The United Kingdom's export of goods value has shown a steady upward trajectory from 1990 to 2023, with some notable fluctuations. In the early 1990s, exports grew moderately, reaching $190 billion by 1992. The real growth began in the late 1990s, driven by the expansion of key industries such as machinery, vehicles, and chemicals. By 2000, the export value surged to $283 billion, and the UK saw strong growth in subsequent years, peaking at $510 billion in 2011. This peak coincided with a period of global economic recovery and increased demand for British goods.
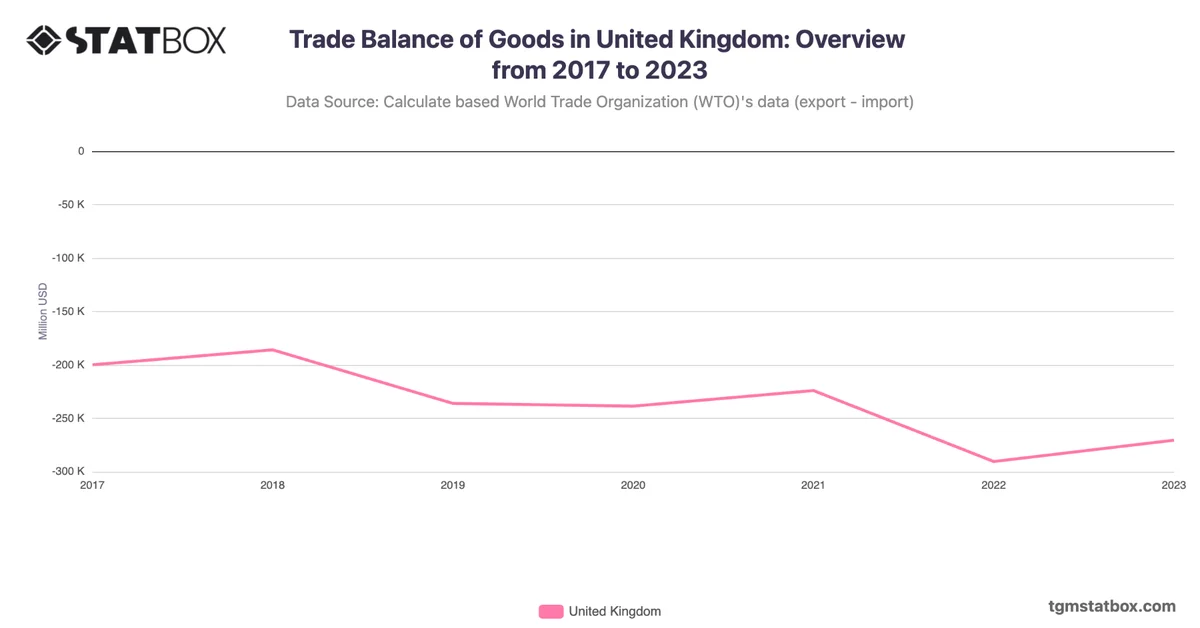
However, the global financial crisis of 2008 caused a significant dip, with exports falling to $358 billion in 2009. Despite the setback, exports rebounded strongly in the following years, reaching a high of $546 billion in 2013, driven by the diversification of export markets and a growing focus on high-tech industries. The UK's exit from the European Union (Brexit) in 2016 created uncertainties that were reflected in the dip of export values in 2016 and 2017. Still, the UK’s export value continued to rise, reaching $532 billion in 2022, despite the challenges posed by the pandemic and global supply chain disruptions. The most recent data from 2023 shows $521 billion, maintaining a resilient export performance.
However, the global financial crisis of 2008 caused a significant dip, with exports falling to $358 billion in 2009. Despite the setback, exports rebounded strongly in the following years, reaching a high of $546 billion in 2013, driven by the diversification of export markets and a growing focus on high-tech industries. The UK's exit from the European Union (Brexit) in 2016 created uncertainties that were reflected in the dip of export values in 2016 and 2017. Still, the UK’s export value continued to rise, reaching $532 billion in 2022, despite the challenges posed by the pandemic and global supply chain disruptions. The most recent data from 2023 shows $521 billion, maintaining a resilient export performance.
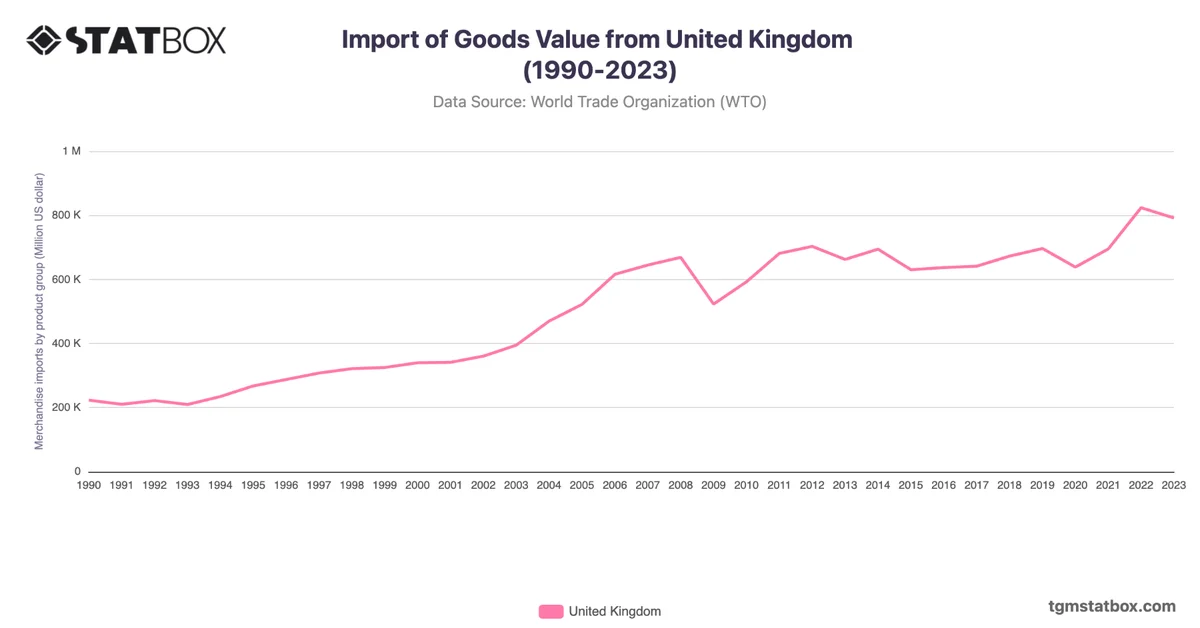
Gain a broader perspective by reviewing Industry sector’s share in UK’s GDP, United Kingdom’s annual GDP growth rate, UK goods import value.