UK Population Growth: A Steady Rise to 2023
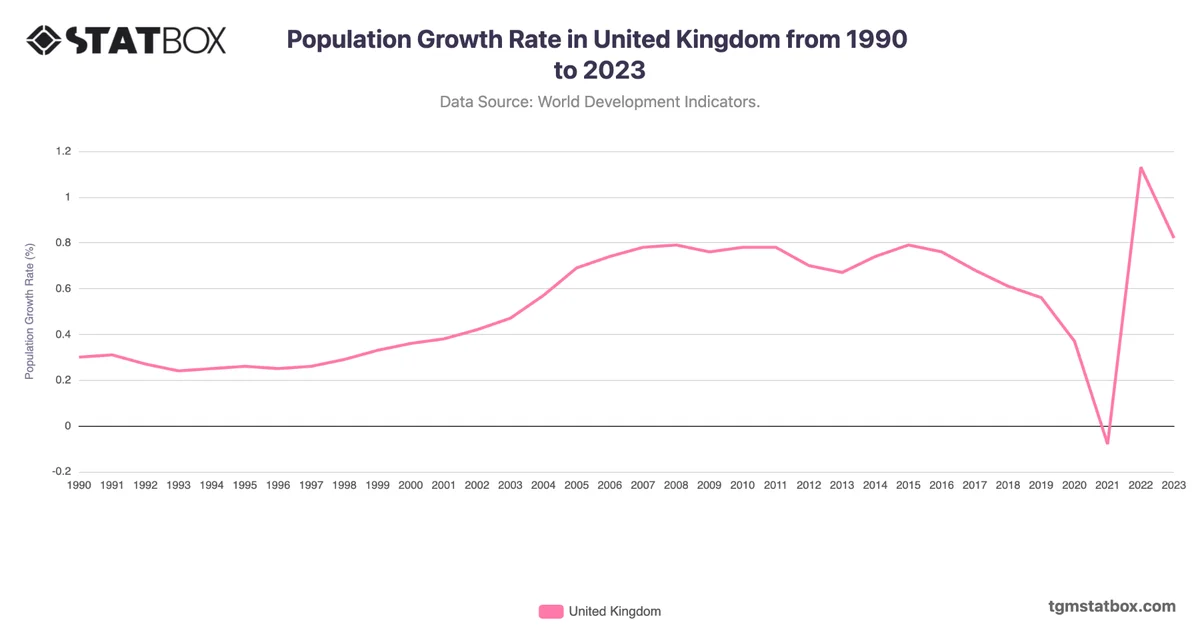
With a population of approximately 67.7 million in 2023, the United Kingdom has seen a consistent upward trajectory in its populace from historical records till recent years. This recent trend reflects a gradual but steady increase, with a rise of over 10 million individuals since the turn of the millennium.
The Impact of Economic Resurgence
The UK population witnessed a significant turning point during the post-war era, notably in 1950, where it stood at around 50.1 million. However, it wasn't until the economic resurgence of the late 20th century, particularly in 1979 during the Thatcher era, that the population saw a notable shift. By 1979, the population had grown to over 56.2 million, marking a pivotal moment in the nation's demographic landscape.
Projected Growth and Urbanization
Looking ahead, projections indicate a continued upward trend in the UK's population, with estimates surpassing 68 million by 2025 and approaching 70 million by the end of the decade. Urbanization is expected to play a significant role, with metropolitan areas attracting a larger share of the population, shaping the socio-economic dynamics of the nation.
Additional Insights
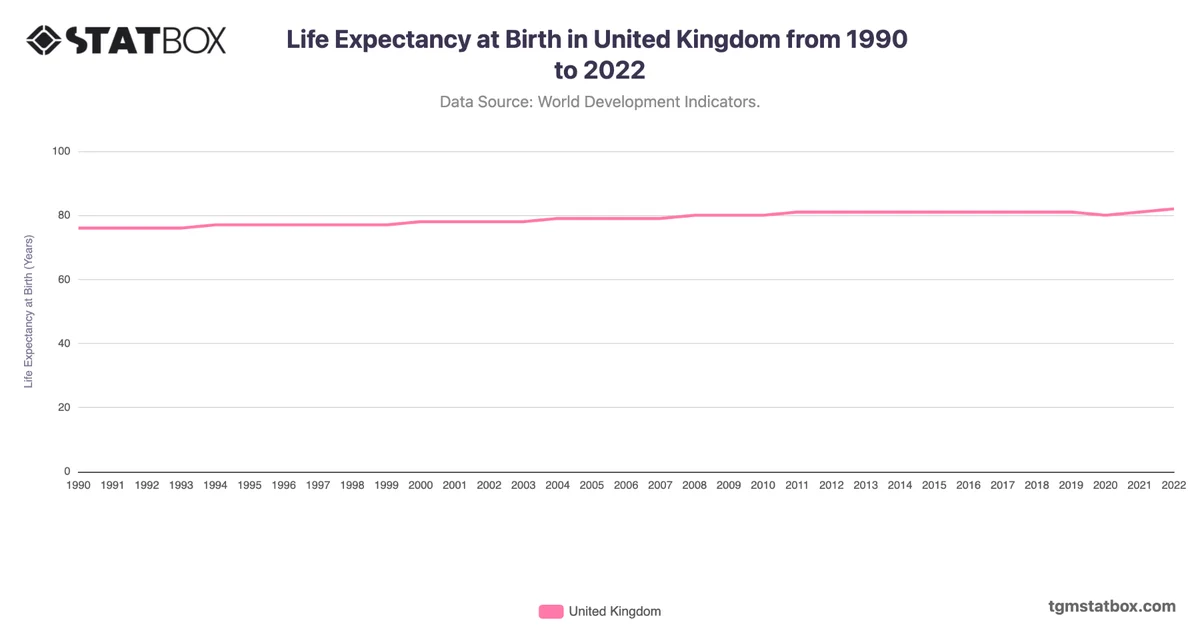
Delve deeper into essential statistics such as the UK's urbanization rate, median age, working-age population percentage, life expectancy, population growth rate, dominant religion, and population density to gain a comprehensive understanding of the nation's demographic landscape. Understanding these metrics is vital for informed decision-making and strategic planning in various sectors.
With a population of approximately 67.7 million in 2023, the United Kingdom has seen a consistent upward trajectory in its populace from historical records till recent years. This recent trend reflects a gradual but steady increase, with a rise of over 10 million individuals since the turn of the millennium.
The Impact of Economic Resurgence
The UK population witnessed a significant turning point during the post-war era, notably in 1950, where it stood at around 50.1 million. However, it wasn't until the economic resurgence of the late 20th century, particularly in 1979 during the Thatcher era, that the population saw a notable shift. By 1979, the population had grown to over 56.2 million, marking a pivotal moment in the nation's demographic landscape.
Projected Growth and Urbanization
Looking ahead, projections indicate a continued upward trend in the UK's population, with estimates surpassing 68 million by 2025 and approaching 70 million by the end of the decade. Urbanization is expected to play a significant role, with metropolitan areas attracting a larger share of the population, shaping the socio-economic dynamics of the nation.
Additional Insights
Delve deeper into essential statistics such as the UK's urbanization rate, median age, working-age population percentage, life expectancy, population growth rate, dominant religion, and population density to gain a comprehensive understanding of the nation's demographic landscape. Understanding these metrics is vital for informed decision-making and strategic planning in various sectors.
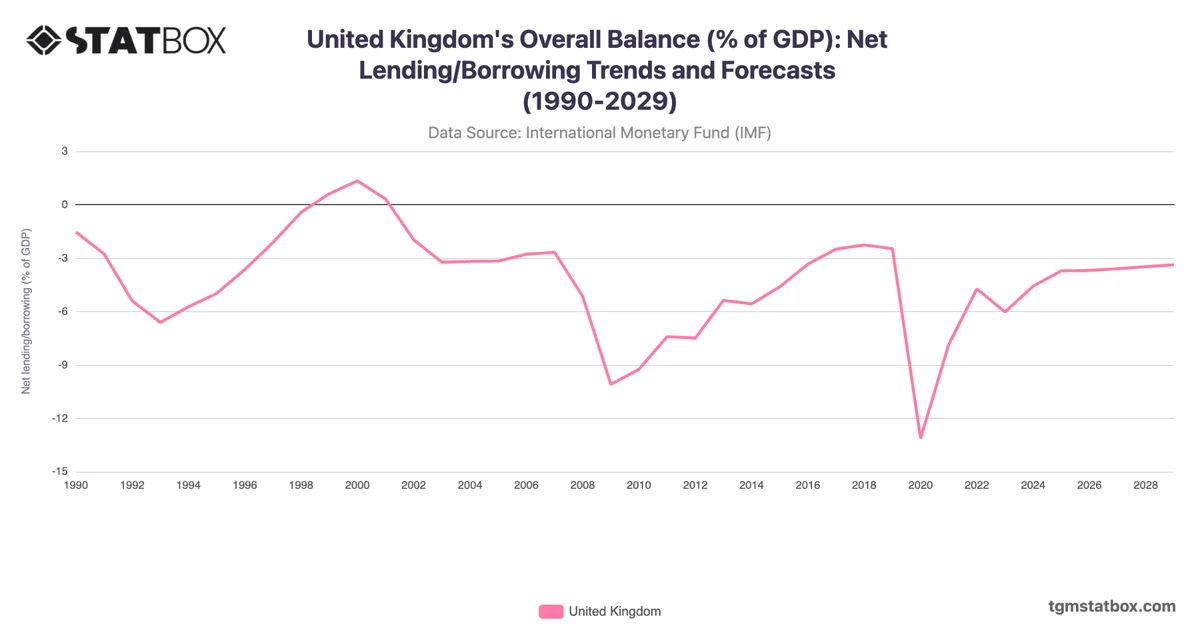
Explore related charts to gain a better understanding of Industry sector’s share in UK’s GDP, United Kingdom’s population median age, United Kingdom's unemployment rate changes.