In the United States, the unemployment rate fluctuated in the early 1990s, peaking at 7.5% in 1992 during a recession. The rate then declined through the decade, reaching a low of 4.0% in 2000, supported by strong economic growth and technological advancement. The 2008 financial crisis led to a significant rise, with unemployment peaking at 9.6% in 2010, before gradually decreasing as the economy recovered.
By 2019, the unemployment rate reached a historic low of 3.7%. However, the COVID-19 pandemic pushed the rate back up to 8.1% in 2020, with subsequent recovery efforts bringing it back to 3.6% by 2023. This volatility underscores the cyclical nature of the U.S. labor market and its responsiveness to economic policy and external shocks.
By 2019, the unemployment rate reached a historic low of 3.7%. However, the COVID-19 pandemic pushed the rate back up to 8.1% in 2020, with subsequent recovery efforts bringing it back to 3.6% by 2023. This volatility underscores the cyclical nature of the U.S. labor market and its responsiveness to economic policy and external shocks.
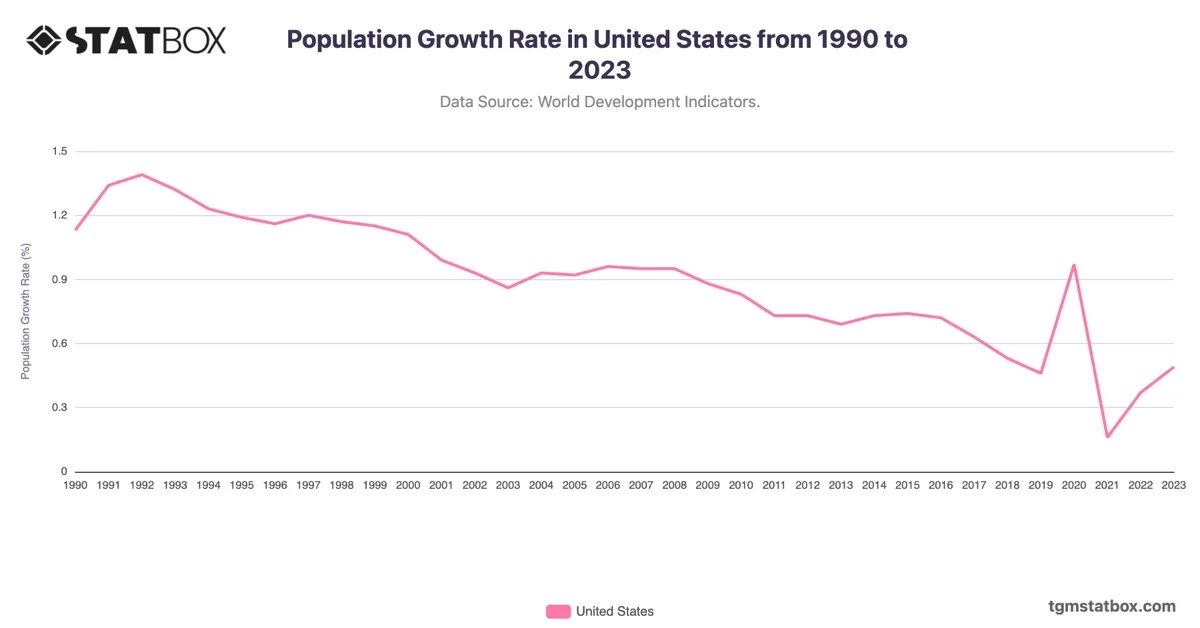
For a deeper dive into the topic, explore Industry sector’s share in US GDP, US net financial position as a percentage of GDP, United States’ population figures.