Charts library
Not sure where to start? Dive into a diverse selection of charts and data visualizations across topics, and find the information you need to drive your research and analysis.
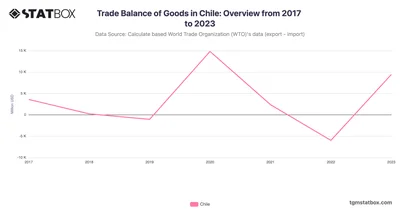
Chile’s trade balance shifted between surplus and deficit, driven by copper exports and commodity price swings. Discover more statistics and insights on TGM StatBox.
 Pro
Pro
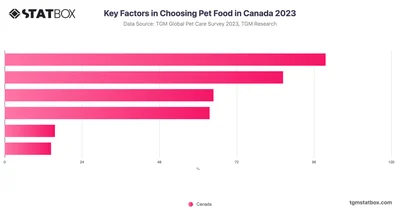
The top three factors influencing pet food purchases of Canadian are quality, price, and addressing specific needs or health concerns of pets.
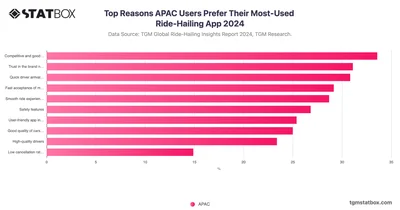
In the APAC region, the top three reasons users prefer their most-used ride-hailing app are competitive pricing, trust in the brand name, and quick driver arrival for pickup.
 Pro
Pro
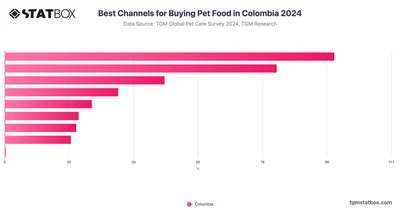
Colombian pet owners show diverse preferences for purchasing pet food, with supermarkets being the most popular channel, used by 51.15% of respondents.
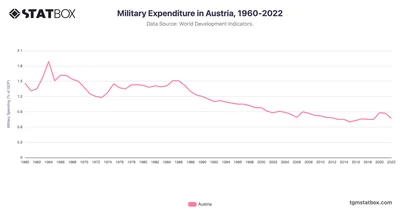
Austria's defense spending stabilized at 1% post-1990, aligned with its neutral stance. Learn more statistics and insights on TGM StatBox.
 Pro
Pro
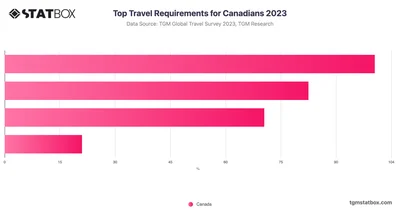
67% of Canadian travelers prioritize quality and comfort during their trips. This preference aligns with global trends, particularly in regions like APAC and Africa.
 Pro
Pro
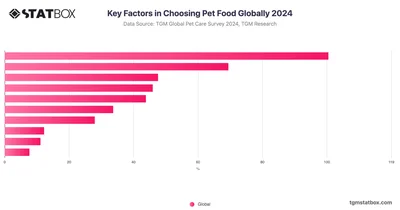
Globally, quality is the foremost consideration for pet owners when selecting food, with 25.12% prioritizing it, while price and veterinarian recommendations follow closely.
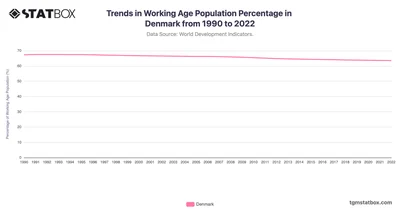
Denmark’s working-age population has decreased from 67.3% in 1990 to 63.5% in 2022. Discover the complete data on Denmark’s working-age population on TGM StatBox.
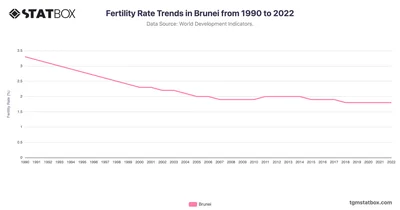
Track fertility trends in Brunei from 1990 to 2022, showcasing demographic changes in a dynamic economy. Discover more statistics and insights on TGM StatBox.
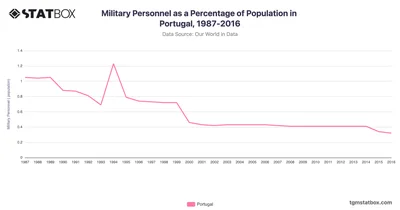
From 1987 to 1990, Portugal saw its military personnel as a percentage of the population decrease to 0.9%. Discover data on Portugal’s military personnel share on TGM StatBox.
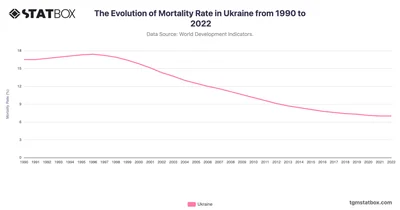
Ukraine’s mortality rate decreased from 16.5 in 1990 to 7.0 in 2022, reflecting healthcare reforms despite socio-economic challenges. Discover more insights on TGM StatBox.
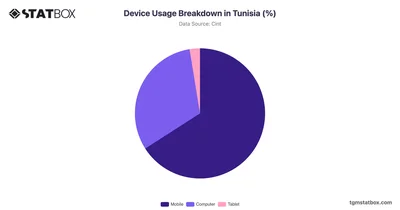
Tunisia demonstrates a notable preference for mobile devices, with 65.92% of users opting for this platform. Discover more about device usage breakdown on TGM StatBox.
 Pro
Pro
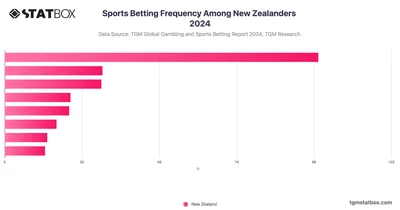
Discover how frequently New Zealanders engage in sports betting, providing valuable insights into their betting habits and trends with this TGM Statbox chart.
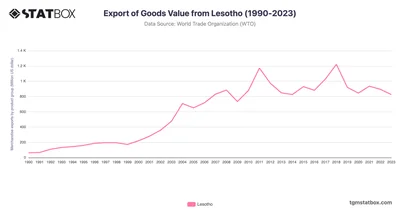
Explore Lesotho's export trends, supported by textiles and trade agreements from 1990 to 2023. Discover more statistics and insights on TGM StatBox.
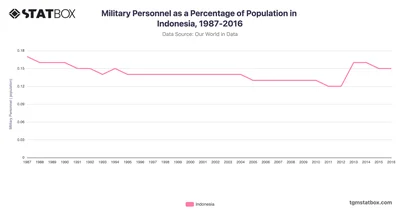
Indonesia maintained a low percentage of military personnel relative to its population, starting at 0.2% in the late 1980s. Discover Indonesia’s data on TGM StatBox.
 Pro
Pro
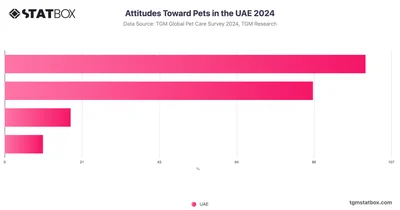
In the UAE, the largest group, comprising 46.66% of respondents, likes all pets, which is slightly lower than the global average.
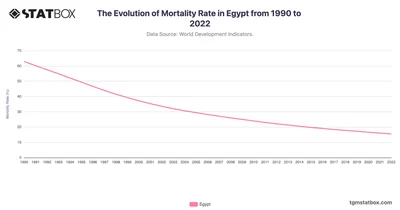
Egypt’s mortality rate fell from 62.9 in 1990 to 15.5 in 2022, driven by improved healthcare services. Discover more statistics and insights on TGM StatBox.
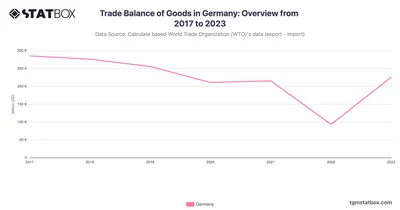
Germany’s trade surplus rebounded in 2023, supported by strong automotive and machinery exports. Discover more statistics and insights on TGM StatBox.
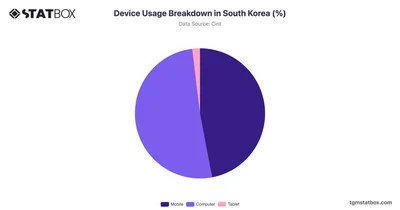
Explore device usage breakdown in South Korea, showcasing percentage distribution of smartphones, tablets, desktops. Analyze the trends shaping digital habits.
 Pro
Pro
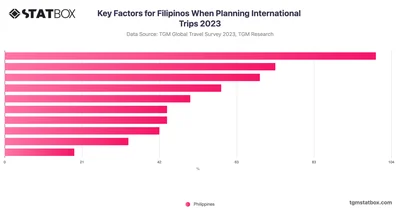
Filipinos prioritize cost when planning international trips, with 48% emphasizing budget-friendly options, significantly influencing their travel decisions.
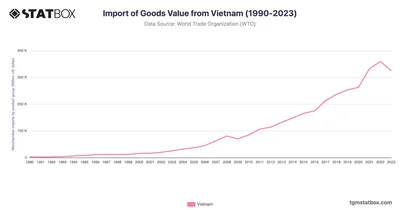
Vietnam’s imports expanded from $2.7B in 1990 to $359.1B in 2022, driven by industrial growth and trade integration. Discover more statistics and insights on TGM StatBox.
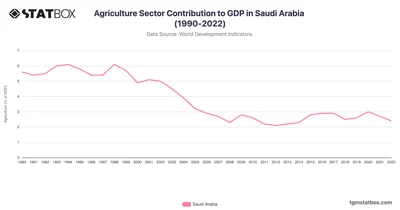
Saudi Arabia’s agriculture sector contributed around 5-6% to GDP in the 1990s, decreasing to 2.4% by 2022. Discover the full KSA’s agriculture GDP data at TGM StatBox.
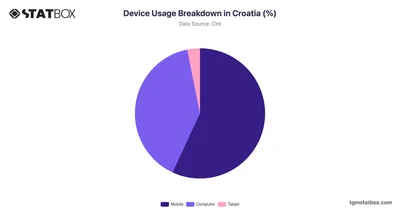
Croatia shows a relatively balanced device usage pattern, with 56.93% opting for mobile devices. Discover more about device usage breakdown in Croatia, on TGM StatBox.
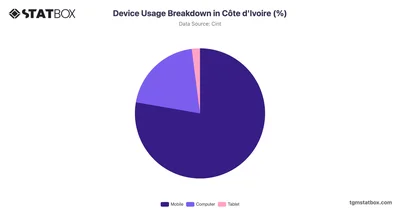
Côte d'Ivoire shows a strong preference for mobile devices, with 77.73% of users opting for them. Discover more about device usage breakdown in Ivory Coast, on TGM StatBox.
 Pro
Pro
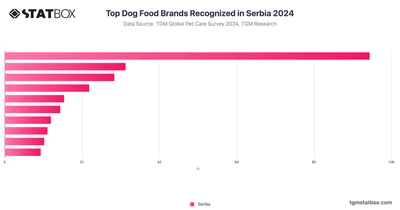
The top three dog food brands recognized by pet owners are Pedigree, Premil, and Royal Canin, with Pedigree leading the pack at 47.2% recognition.
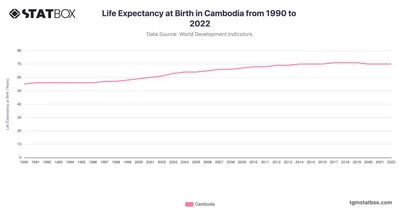
Cambodia's life expectancy grew from 55 in 1990 to 70 in 2022, driven by post-conflict recovery and health investments. Discover more statistics and insights on TGM StatBox.
 Pro
Pro
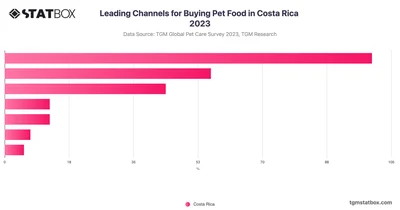
Supermarkets are the primary channel for pet food purchases, with 57% of pet owners choosing this option, followed by independent pet stores at 32%.
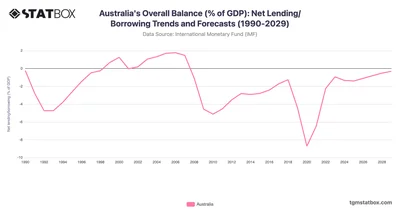
Australia’s fiscal performance shows recovery post-pandemic, with steady deficit narrowing projected. Discover more statistics and insights on TGM StatBox.
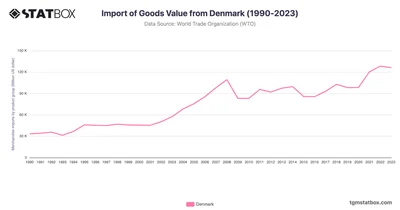
Denmark’s imports rose from $33.3B in 1990 to $128.3B in 2022, showcasing its robust trade-driven economy. Discover more statistics and insights on TGM StatBox.
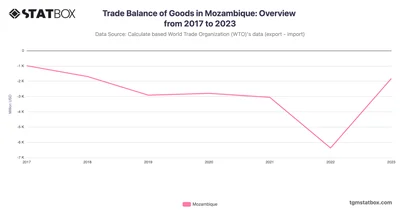
Mozambique’s trade deficit peaked in 2022, reflecting infrastructure-related imports, before narrowing in 2023. Discover more statistics and insights on TGM StatBox.






