Charts library
Not sure where to start? Dive into a diverse selection of charts and data visualizations across topics, and find the information you need to drive your research and analysis.
 Pro
Pro
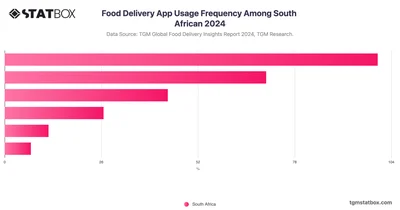
Around 48.5% of South African users order food delivery at least once a week, while many others order a few times a month—showing steady, practical use.
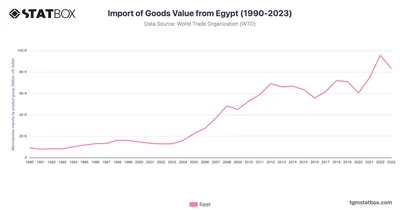
Egypt’s imports surged from $9.2B in 1990 to $95.6B in 2022, driven by industrial growth and energy needs. Discover more statistics and insights on TGM StatBox.
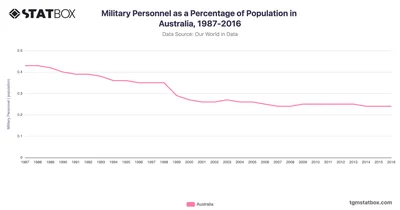
Military personnel as a percentage of the population in Australia from 1987 to 2016 reveals a steady trend with minor fluctuations. Check full data on TGM StatBox.
 Pro
Pro
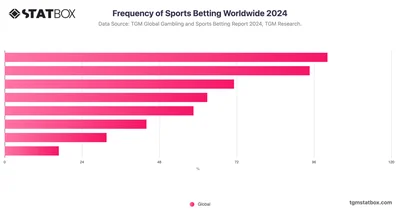
Sports betting frequency varies significantly worldwide, with the highest percentage of bettors placing bets a few times a week. Learn more statistics on TGM StatBox.
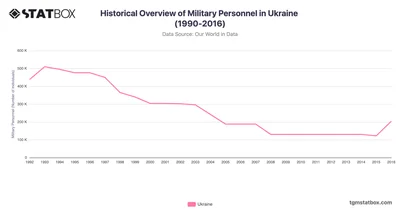
Ukraine's military personnel experienced a sharp decline from 1992, following its independence from the Soviet Union. Discover more statistics and insights on TGM StatBox.
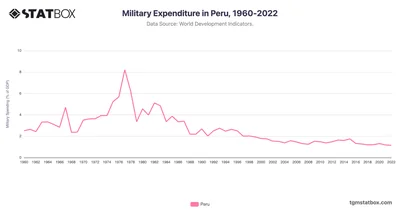
Peru's defense spending fell to 1.2% by 2022, prioritizing social growth. Find more statistics and insights on TGM StatBox.
 Pro
Pro
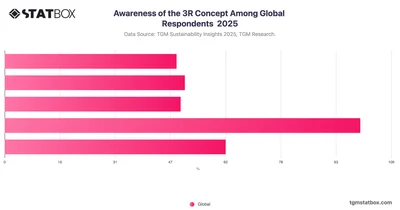
Global awareness of the “3R” concept, Reduce, Reuse, Recycle, remains uneven. Only around 16% of respondents say they are definitely familiar with the idea.
 Pro
Pro
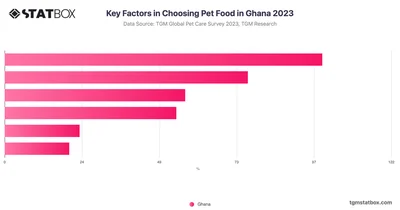
Ghanaian pet owners demonstrate a strong preference for quality over cost when purchasing pet food, with 82.14% prioritizing quality compared to 62.89% considering price.
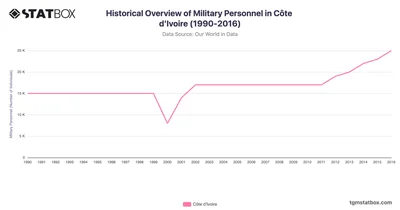
Côte d'Ivoire’s military personnel count remained stable at 15,000 from 1990 to 1999 but experienced significant changes in the 2000s. Discover more on TGM StatBox.
 Pro
Pro
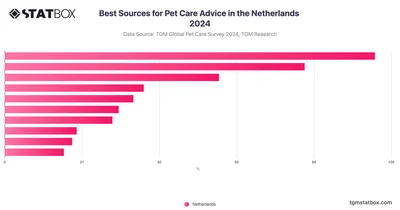
Dutch pet owners primarily seek advice on pet care from various sources, with veterinarians being the most trusted, cited by 47.9% of respondents.
 Pro
Pro
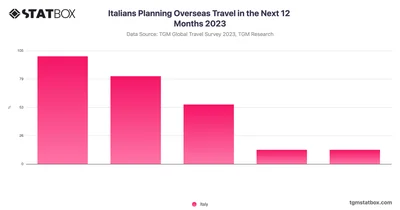
With 68.54% of Italians likely or very likely to travel abroad, there’s a strong demand for international experiences, benefiting travel agencies.
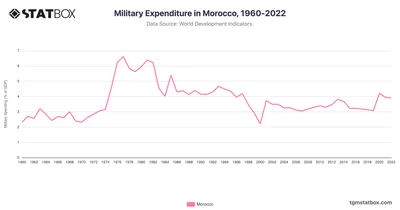
Morocco's military expenditure rose to 3.9% by 2022 amid modernization. Learn more statistics and insights on TGM StatBox.
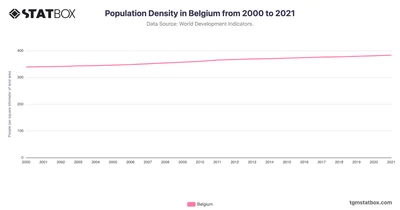
Belgium, with one of the highest population densities in Europe, saw its density increase from 339 people per square kilometer in 2000 to 383 in 2021.
 Pro
Pro
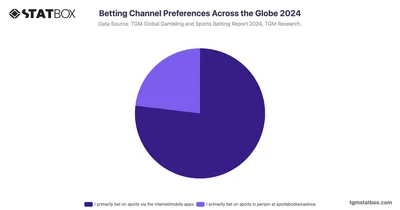
The digital transformation of sports betting is clear, with over 77% of global bettors preferring to place their bets through internet platforms and mobile apps.
 Pro
Pro
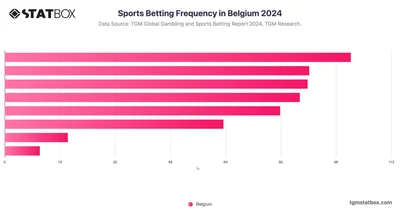
In Belgium, sports betting engagement varies, with 18.8% betting a few times a year, followed by those who bet weekly and less than once a year.
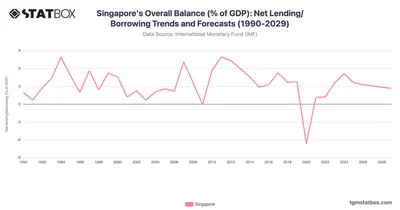
Singapore’s fiscal surpluses highlight resilience, with strong recovery post-pandemic. Discover more statistics and insights on TGM StatBox.
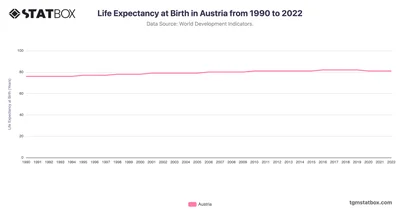
Austria's life expectancy rose from 76 in 1990 to 81 in 2022, showcasing strong healthcare advancements. Discover more statistics and insights on TGM StatBox.
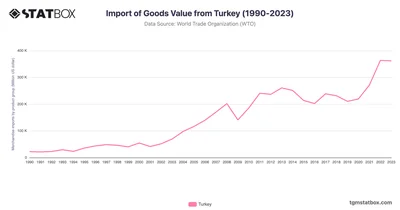
Turkey’s imports climbed from $22.3B in 1990 to $363.7B in 2022, driven by energy and industrial inputs. Discover more statistics and insights on TGM StatBox.
 Pro
Pro
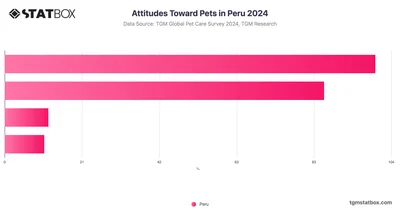
According to survey results, 41.3% of Peruvians respondents express a fondness for all pets, while 47.9% prefer specific types of pets.
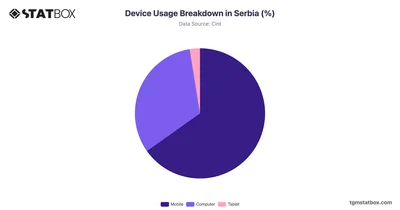
Serbia exhibits a notable inclination towards mobile devices, with 65.18% of users opting for them. Discover more about device usage breakdown in Serbia, on TGM StatBox.
 Pro
Pro
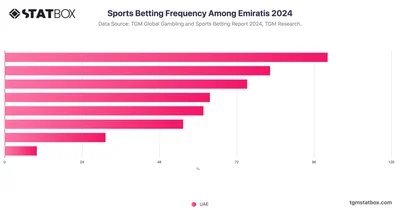
Discover how frequently Emiratis engage in sports betting, offering insights into their betting habits and trends with this TGM Statbox chart.
 Pro
Pro
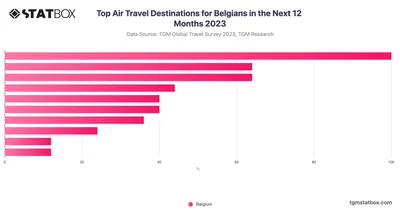
Belgian travelers have a strong preference for Western Europe, with 25% planning trips to the region. Its popularity likely stems from familiarity and proximity.
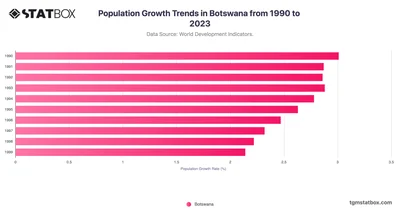
The chart reflects Botswana’s demographic journey from high growth in 1990s to a more moderated rate since 2000s. Discover how Botswana has been growing on TGM StatBox.
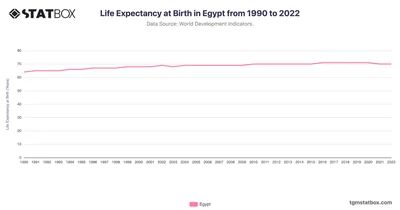
Egypt’s life expectancy rose from 64 in 1990 to 71 in 2022, highlighting public health initiatives and healthcare access. Discover more statistics and insights on TGM StatBox.
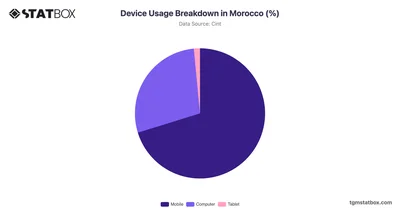
Morocco demonstrates a solid inclination towards mobile devices, with 70.23% of users opting for them. Discover more about device usage breakdown in Morocco, on TGM StatBox.
 Pro
Pro
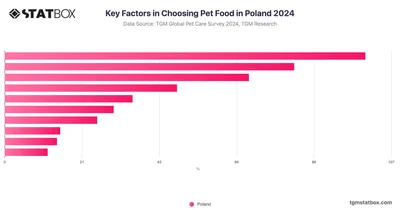
When choosing pet food, quality is the top priority for 23.32% of Polish respondents, while 18.72% emphasize the importance of ingredient composition.
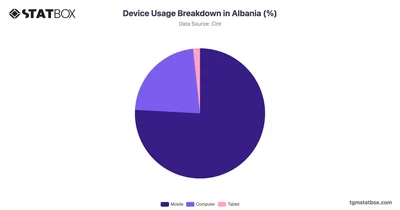
In Albania, mobile devices dominate the digital landscape with a usage rate of 75.86%. Discover more about device usage breakdown in Albania, on TGM StatBox.
 Pro
Pro
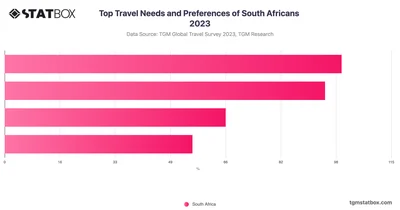
Quality and comfort are crucial for South African travelers, with 61% prioritizing these aspects when planning their trips.
 Pro
Pro
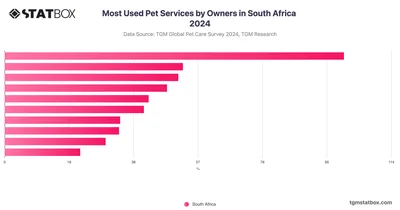
Veterinary care is the most commonly used service in South Africa, with 52.65% of respondents relying on it. Professional grooming follows closely at 26.95%.
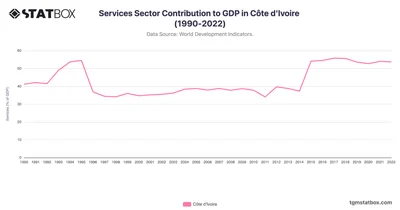
Côte d'Ivoire’s Services sector contribution grew markedly, from 41.2% in 1990 to over 55% by 2018. Find more Ivory Coast's GDP data over the years on TGM StatBox.






