Charts library
Not sure where to start? Dive into a diverse selection of charts and data visualizations across topics, and find the information you need to drive your research and analysis.
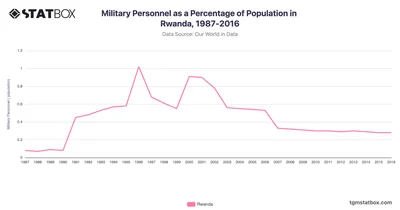
Rwanda's military personnel data from 1987 to 2016 reflects significant fluctuations that closely mirror Rwanda's periods of conflict, stabilization, and reform.
 Pro
Pro
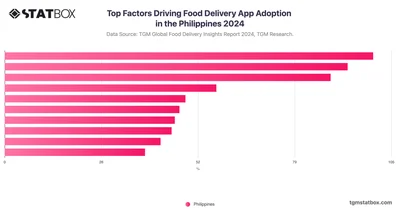
Convenience is the main reason Filipinos use food delivery apps—helping with busy schedules, saving time, and making everyday life easier and more flexible.
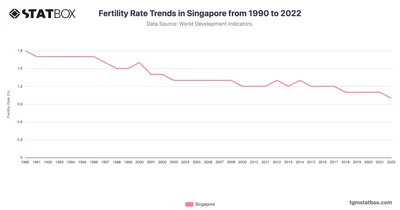
Analyze Singapore's fertility trends from 1990 to 2022, highlighting challenges in sustaining population growth. Discover more statistics and insights on TGM StatBox.
 Pro
Pro
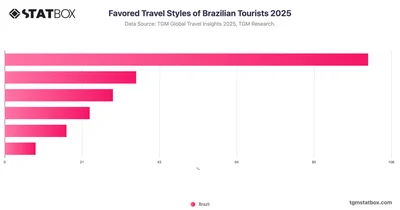
Brazilian tourists (47%) show a strong preference for leisure-focused travel. They also want to travel to explore culture and seek health and well-being getaways.
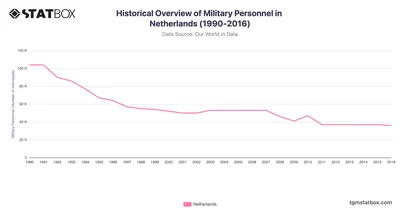
The Netherlands experienced a significant reduction in military personnel between 1990 and 2016, driven by defense policy changes and shifting global priorities.
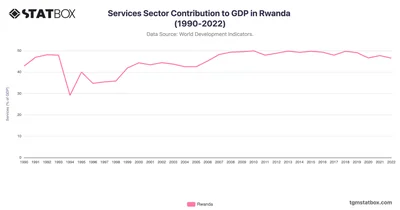
Rwanda's services sector has consistently contributed a significant portion to the country's GDP over the past few decades. Find more data at TGM StatBox.
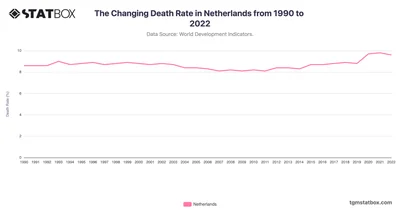
The Netherlands’ death rate illustrates public health improvements and demographic factors. Discover more statistics and insights on TGM StatBox.
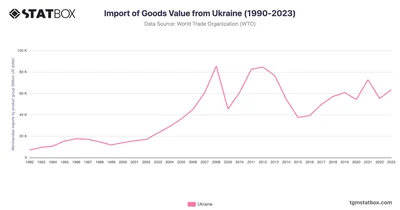
Ukraine’s imports rose from $7.1B in 1992 to $63.5B in 2023, highlighting industrial and geopolitical influences. Discover more statistics and insights on TGM StatBox.
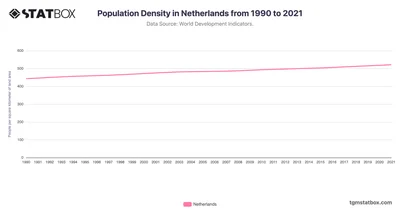
The Netherlands has one of the highest population densities globally, growing from 443 people per square kilometer in 1990 to 521 by 2021. See the full data on TGM StatBox.
 Pro
Pro
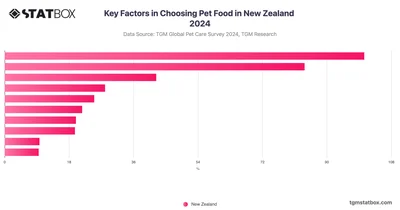
When it comes to selecting pet food, price emerges as the most significant factor for consumers in New Zealand, surpassing the importance of quality.
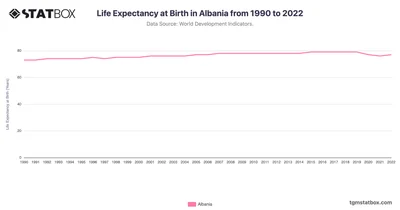
Albania’s life expectancy rose from 73 in 1990 to 77 in 2022, showcasing healthcare and living standard improvements. Discover more statistics and insights on TGM StatBox.
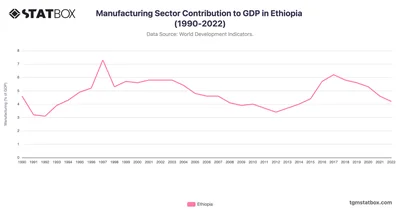
Ethiopia’s manufacturing sector maintained a low but steady GDP contribution over three decades, peaking at 7.3% in 1997. See more Ethiopia’s data on TGM StatBox.
 Pro
Pro
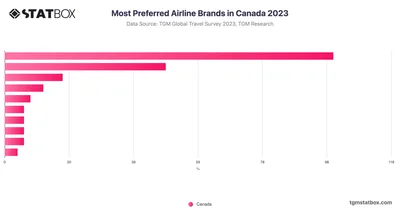
Air Canada dominates as the most preferred airline among Canadians, securing 50.6% of the votes. WestJet also holds a substantial share with 25.1%.
 Pro
Pro
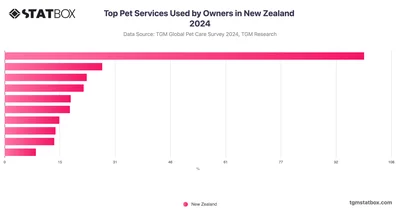
Looking at pet service usage in New Zealand, veterinary care is by far the most commonly used service at 65.07% of pet owners, followed by professional grooming at 14.86%.
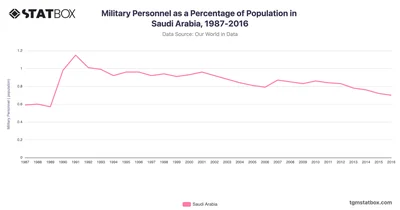
Saudi Arabia’s military personnel as a percentage of the population fluctuated significantly. Discover data on KSA’s military personnel share on TGM StatBox.
 Pro
Pro
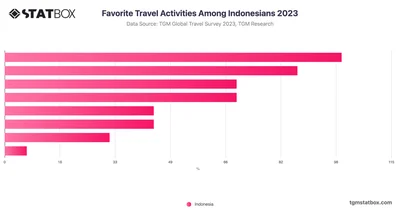
Indonesian travelers prioritize beach and leisure activities, with 61% favoring this category, reflecting a trend seen in global patterns, especially in Latin America.
 Pro
Pro
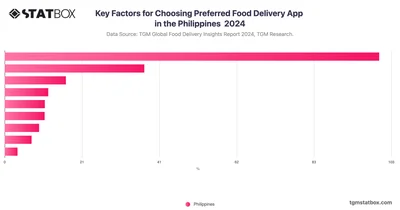
Trust drives food delivery choices in the Philippines—48% pick apps they trust most, with speed and reliability also key to winning customer loyalty.
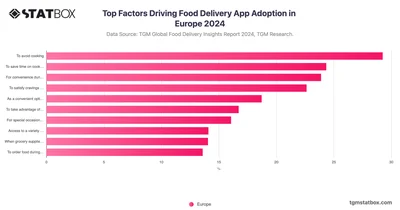
For Europeans, food delivery is about ease and comfort—mainly to avoid cooking and save time, not urgency or deals, but to simplify busy daily routines.
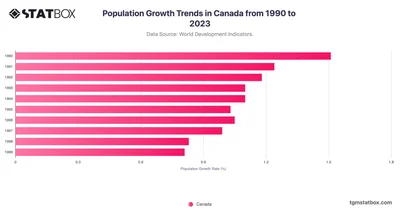
Understand Canada’s population growth fueled by immigration and urbanization. Discover more statistics and insights in your target country on TGM StatBox.
 Pro
Pro
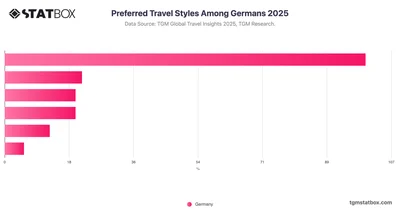
Travel for many Germans is about slowing down and recharging. Over half say relaxation trips suit them best, whether it's unwinding by the sea or escaping into nature.
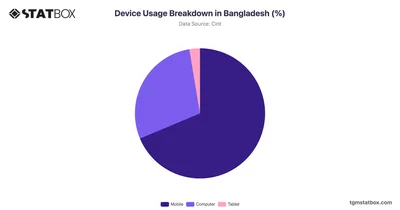
Bangladesh shows a solid preference for mobile devices, with 68.69% usage. Discover more about device usage breakdown in Bangladesh, on TGM StatBox.
 Pro
Pro
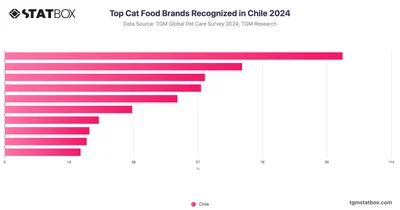
In Chile, Whiskas dominates the cat food market with a brand recognition of 26.22%, while Purina Cat Chow follows with 18.42% and Purina comes in at 15.54%.
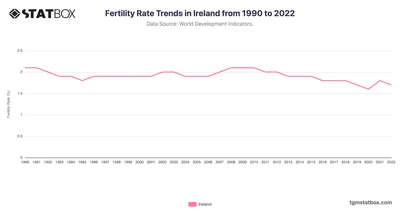
Track Ireland's fertility patterns from 1990 to 2022, showcasing population changes in a rapidly evolving economy. Discover more statistics and insights on TGM StatBox.
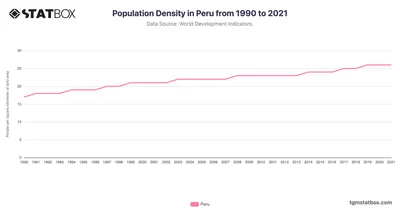
Peru’s population density increased gradually from 17 people per square kilometer in 1990 to 26 in 2021. See the full Peru’s population density data on TGM StatBox.
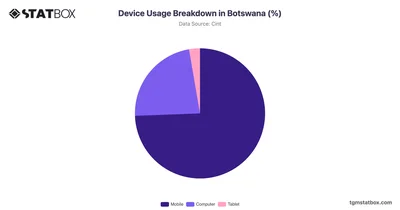
Botswana's device usage shows a strong preference for mobile devices at 74.41%. Discover more about device usage breakdown in Botswana, on TGM StatBox.
 Pro
Pro
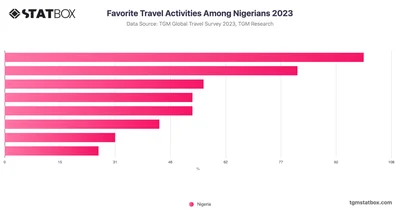
Nigerian travel activities reflect diverse interests, with shopping leading as the most popular pursuit for 65% of travelers.
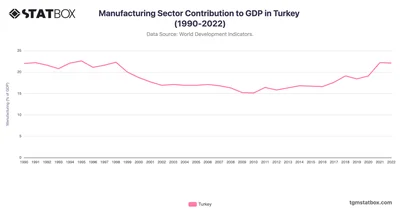
The manufacturing sector's contribution to Turkey's GDP has demonstrated notable fluctuations between 1990 and 2022. Find more data and insights on TGM StatBox.
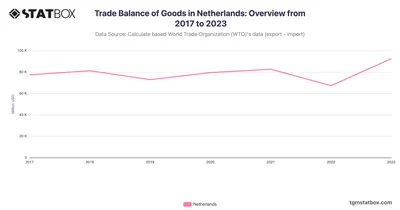
The Netherlands recorded its highest trade surplus in 2023, driven by robust exports of chemicals and machinery. Discover more statistics and insights on TGM StatBox.
 Pro
Pro
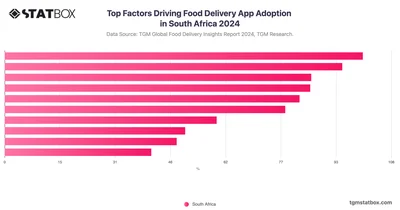
In South Africa, 32.4% use food delivery apps for convenience during busy schedules—showing how these services support practical, time-saving daily routines.
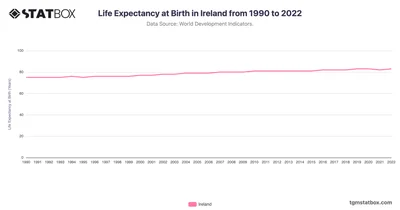
Ireland’s life expectancy grew from 75 in 1990 to 83 in 2022, driven by economic growth and healthcare improvements. Discover more statistics and insights on TGM StatBox.






