Charts library
Not sure where to start? Dive into a diverse selection of charts and data visualizations across topics, and find the information you need to drive your research and analysis.
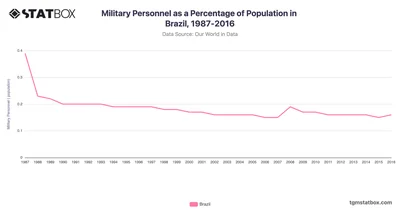
Brazil’s military personnel percentage declined to 0.2% by 1988, maintaining this level through 2016. Discover data on Brazil’s military personnel share on TGM StatBox.
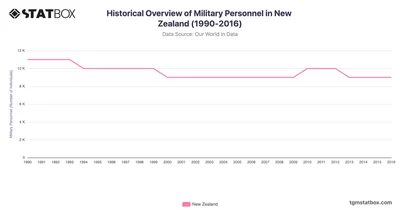
New Zealand’s military personnel numbers have remained notably stable, reflecting its focus on a compact but capable defense force. Discover more on TGM StatBox.
 Pro
Pro
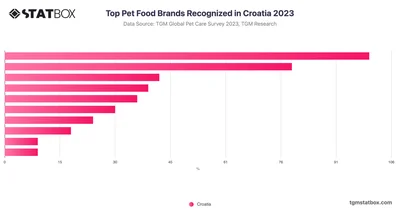
Whiskas emerged as the leading pet food brand in Croatia, capturing 33% of the market share. The brand has strong appeal among pet owners in the region.
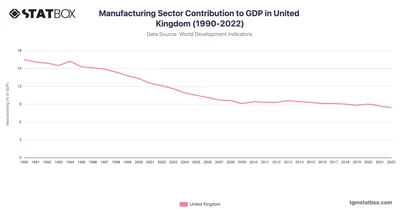
In the UK, manufacturing's GDP share began at 16.5% in 1990 but saw a steady decline through the 1990s, impacted by a focus on services, particularly finance.
 Pro
Pro
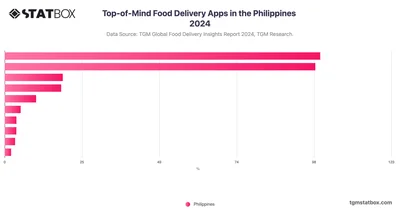
In the Philippines, Foodpanda and GrabFood are the most recognized food delivery apps, with 81.61% and 80.34% of users mentioning them first.
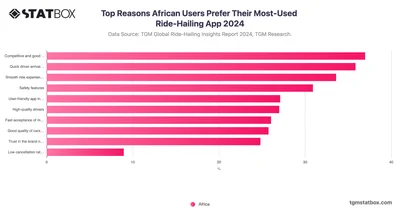
The top three reasons African users choose their most-used ride-hailing app are competitive pricing, quick driver arrival, and a smooth ride experience.
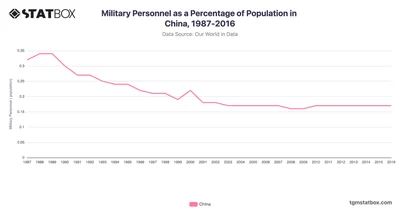
Military personnel as a percentage of the population in China 1987-2016 shows a consistent trend of stability in military size relative to its vast population. Get full data on TGM StatBox.
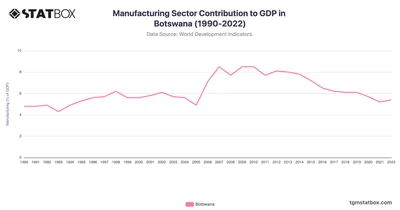
Botswana’s manufacturing contribution rose modestly from 4.8% in 1990, peaking at 8.5% in 2007. See more Botswana’s GDP data over the years on TGM StatBox.
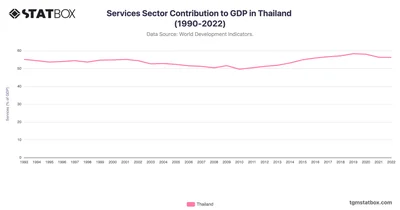
Thailand’s services sector has seen gradual growth since the early 1990s, driven by tourism and trade. Find more Thailand’s GDP data over the years on TGM StatBox.
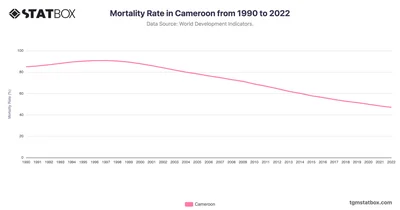
Cameroon’s mortality rate fell from 84.9 in 1990 to 47.0 in 2022, driven by public health initiatives combating infectious diseases. Discover more statistics on TGM StatBox.
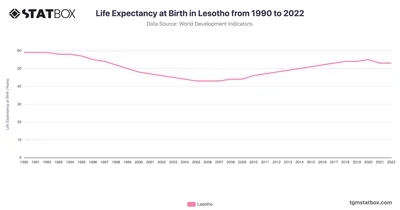
Lesotho's life expectancy recovered from a low of 43 in 2005 to 53 in 2022, driven by healthcare improvements. Discover more statistics and insights on TGM StatBox.
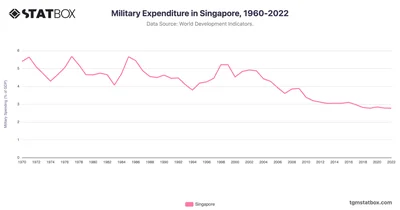
Singapore's defense spending stabilized at 2.8% by 2022, emphasizing readiness. Find more statistics and insights on TGM StatBox.
 Pro
Pro
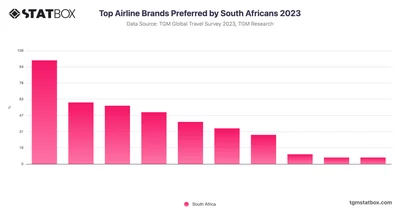
South African Airways (SAA) emerges as the clear favorite among South African travelers, with 31.8% of respondents indicating it as their preferred airline.
 Pro
Pro
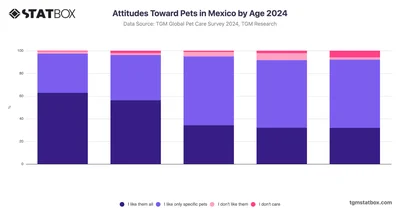
Younger adults (18-24) show the highest rate of positive attitudes, with 62.8% expressing that they "like them all". This enthusiasm decreases among the 25-34 age group.
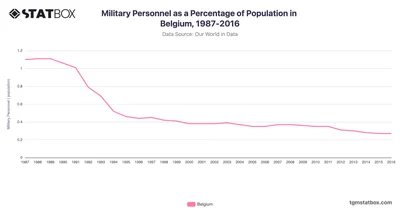
Belgium’s military personnel percentage declined sharply from 1.1% in 1987 to 0.3% in 2016. Discover data on Belgium’s military personnel share on TGM StatBox.
 Pro
Pro
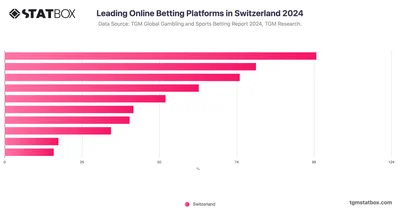
Identify the leading online betting platforms in Switzerland, offering insights into the most popular platforms and their market share with this TGM Statbox chart.
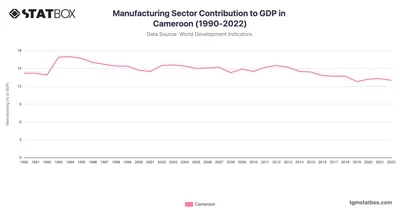
Cameroon’s manufacturing sector contributed steadily to GDP over the past three decades, with a peak at 17.0% in 1994. See more Cameroon’s data on TGM StatBox.
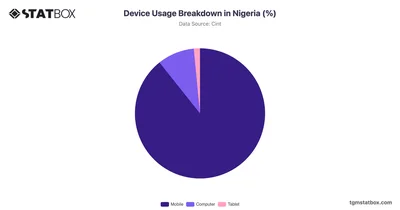
Nigeria displays a remarkable inclination towards mobile devices, with 89.30% of users opting for them. Discover more about device usage breakdown in Nigeria, on TGM StatBox.
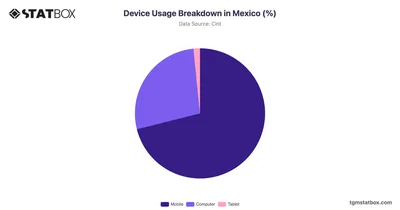
Gain insights into device usage landscape in Mexico, highlighting percentage share of smartphones, tablets, desktops. Discover more digital preferences at TGM StatBox.
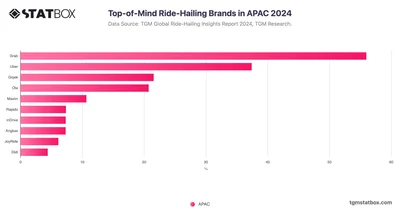
When thinking of ride-hailing applications operating in the APAC region, the top brands that come to mind are Grab, Uber, and Gojek.
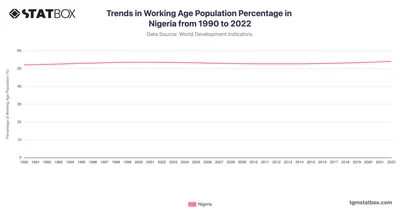
After a brief period of stability and minor declines from 2000 to 2010, Nigeria's working-age population started to rise again. Discover the complete data on TGM StatBox.
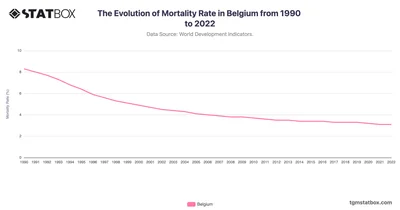
Belgium’s mortality rate dropped from 8.3 in 1990 to 3.1 in 2022, reflecting healthcare improvements. Discover more statistics and insights on TGM StatBox.
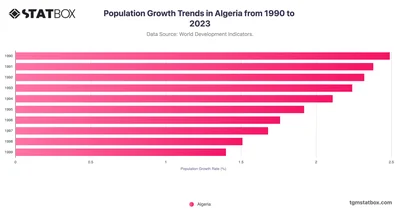
Since 2018, Algeria's Population Growth rate declined steadily, reaching 1.6% in 2023, influenced by slowing birth rates, evolving family structures, and increasingly urban population.
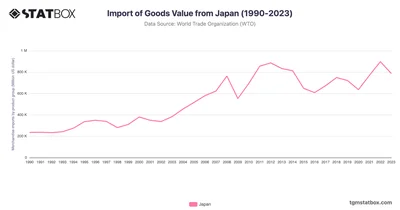
Japan’s imports increased from $235.3B in 1990 to $897.1B in 2022, driven by energy and technology demands. Discover more statistics and insights on TGM StatBox.
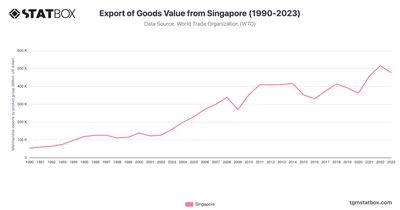
See Singapore's export journey from 1990 to 2023, emphasizing technology and re-export trade. Discover more statistics and insights on TGM StatBox.
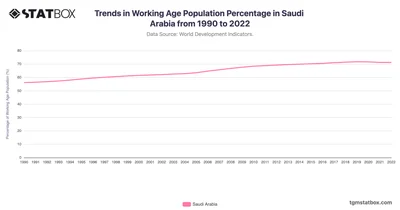
Saudi Arabia experienced a consistent increase in its working-age population from 56.1% in 1990 to 71.7% in 2019. Discover the complete data on TGM StatBox.
 Pro
Pro
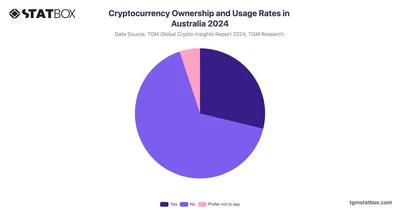
66% of Australians have never owned or used cryptocurrency, highlighting key adoption barriers like security concerns, trust issues, and regulatory uncertainty.
 Pro
Pro
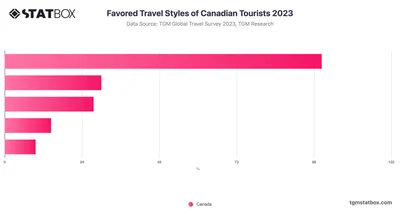
Canadian travelers mostly prefer relaxation and discovery trips, which offers cultural exploration and leisure activities, highlighting a desire for stress-free experiences.
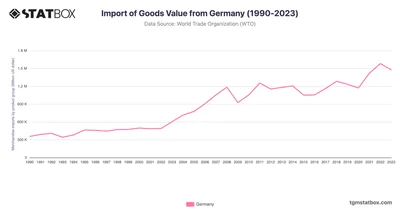
Germany’s imports increased from $355.6B in 1990 to $1.58T in 2022, showcasing its industrial and export-driven economy. Discover more statistics and insights on TGM StatBox.
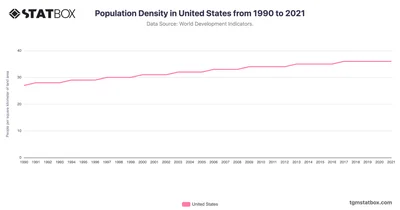
The United States experienced a gradual increase in population density to 36 people per square kilometer in 2021. See the full USA's population density data on TGM StatBox.






