Insights library
Explore a wide range of consumer insights and statistics across industries. Discover charts on behaviors, preferences, attitudes, and market trends to find the data most relevant to your research and decision-making.
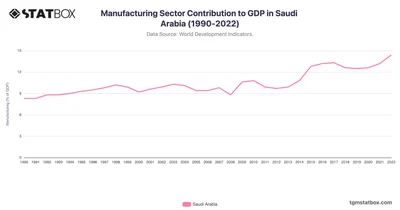
Saudi Arabia's manufacturing sector experienced gradual growth from 8.3% in 1990 to 14.4% in 2022. See more Saudi Arabia's GDP data on TGM StatBox.
 Pro
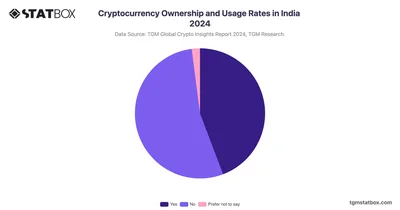
With 44% of respondents having owned or used cryptocurrency, there is a solid base of active users, indicating growing interest in digital currencies.
 Pro
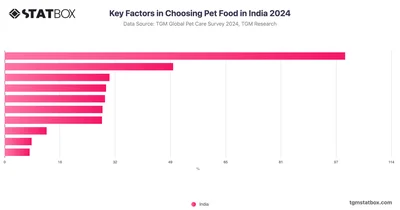
Quality (30.82%) is the top priority for Indian pet owners when selecting pet food, followed by professional advice, price, and availability.
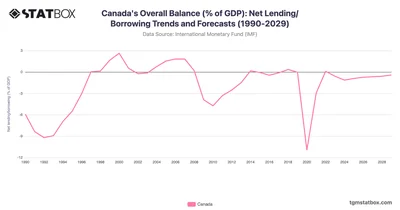
Canada’s fiscal trends show recovery post-pandemic, with moderate deficits forecasted. Discover more statistics and insights on TGM StatBox.
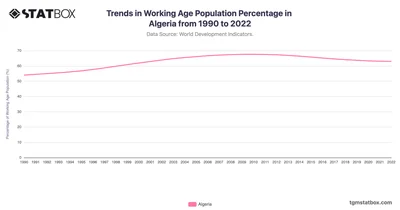
The chart shows the trends in Algeria's working-age population percentage from 1990 to 2022. Discover the complete data on Algeria's working-age population on TGM StatBox.
 Pro
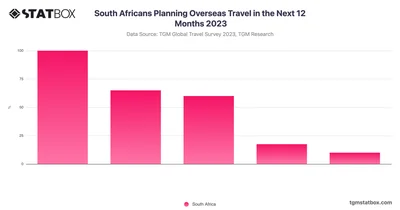
In South Africa, 66.13% of respondents express a likelihood of travel ing overseas in 2023, slightly below the global average of 68.64%.
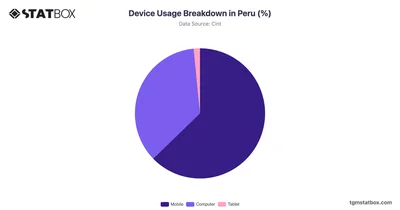
Peru exhibits a significant inclination towards mobile devices, with 62.74% of users relying on them. Discover more about device usage breakdown on TGM StatBox.
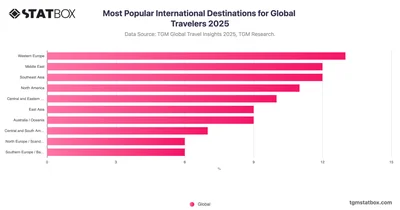
Global travel in 2025 is fragmented; Middle East and Southeast Asia rise as Europe and North America lose dominance. Explore full data on TGM StatBox.
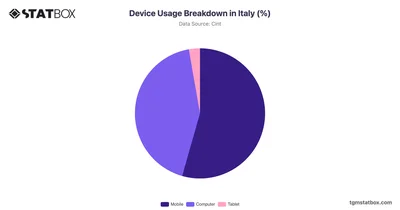
Discover the detailed breakdown of device usage in Italy, with percentage insights into the prevalence of smartphones, tablets, and desktops in daily life.
 Pro
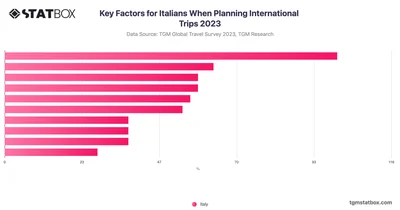
Italians prioritize cost and affordability when planning their international trips, with 43% considering this factor crucial.
 Pro
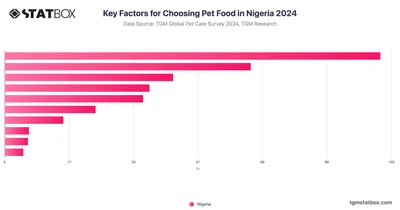
Nigerian pet owners demonstrate distinct priorities when selecting pet food. Quality leads as the primary concern, with 29.15% emphasizing its importance.
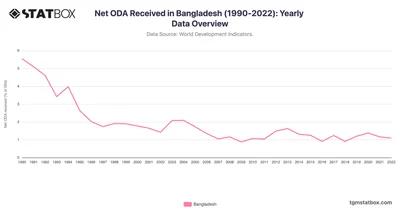
Bangladesh’s Net ODA fell from 5.5% in 1990 to 1% by the 2020s, showcasing its economic resilience and reduced reliance on aid. Discover more statistics and insights on TGM StatBox.
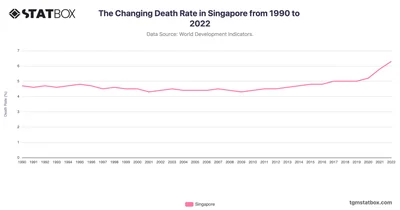
Singapore’s death rate reflects its advanced healthcare system and aging population. Discover more statistics and insights on TGM StatBox.
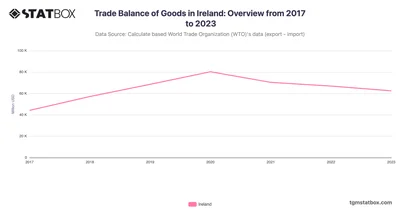
Ireland’s trade surplus softened in 2023 but remained supported by strong pharmaceutical exports. Discover more statistics and insights on TGM StatBox.
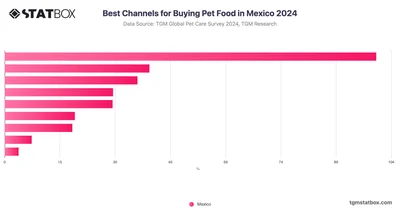 Pro
Supermarkets are the most popular channel for purchasing pet food in Mexico, with 67.27% of pet owners choosing this option.
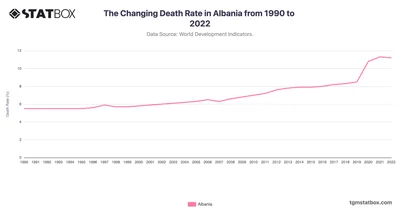
Explore Albania’s death rate trends shaped by healthcare progress and demographic changes. Discover more statistics and insights on TGM StatBox.
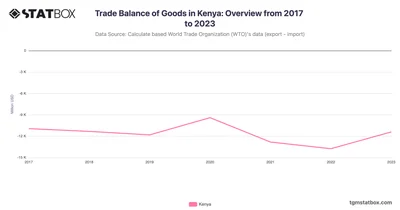
Kenya’s trade deficit narrowed in 2023 due to rising exports of tea and textiles, though import reliance persists. Discover more statistics and insights on TGM StatBox.
 Pro
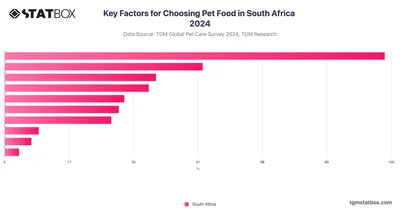
South African pet owners prioritize several key factors when selecting pet food, with quality emerging as the most important consideration at 29.49%.
 Pro
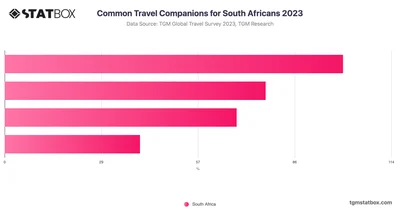
In South Africa, family is the primary travel companion, with 35% of respondents indicating they most often travel with their relatives.
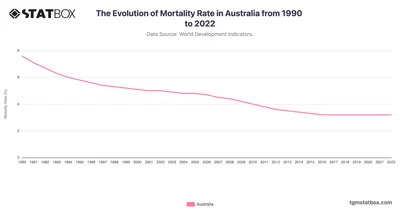
Australia’s mortality rate dropped from 7.6 in 1990 to 3.2 in 2022, reflecting effective healthcare and public health strategies. Discover more insights on TGM StatBox.
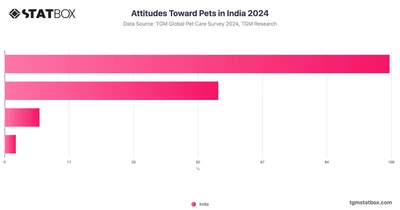 Pro
The majority of Indian respondents (59.72%) express a positive sentiment, stating that they "like them all". A significant portion indicate that they "like only specific pets".
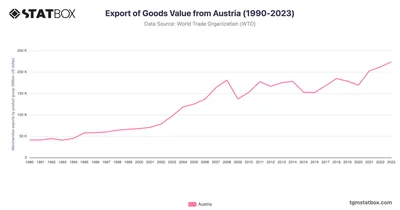
Delve into Austria's export performance from 1990 to 2023, supported by machinery and trade integration. Discover more statistics and insights on TGM StatBox.
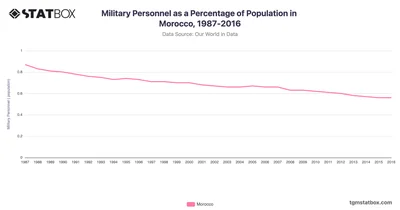
Morocco’s military personnel as a percentage of the population showed a gradual decrease from 1987 to 2016. Check full data on Morocco’s military personnel share on TGM StatBox.
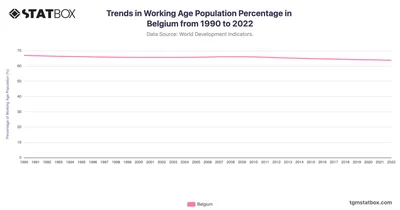
In Belgium, the working-age population showed a gradual decline from 66.9% in 1990 to 63.7% in 2022. Discover complete data of Belgium on TGM StatBox.
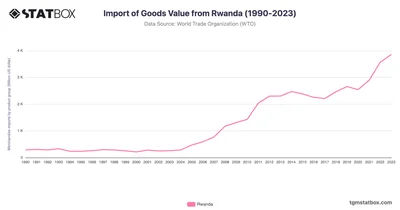
Rwanda's import of goods has demonstrated significant growth over the decades, reflecting its evolving economic landscape and increasing demand for foreign products.
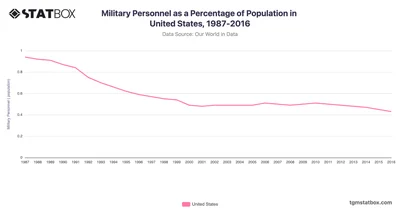
In the United States, military personnel as a percentage of the population showed a steady decline to 0.4% by 2016. Discover data on the USA’s military personnel share on TGM StatBox.
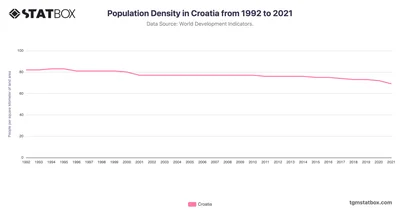
Croatia’s population density fluctuated between 82 and 77 people per square kilometer from 1992 to the early 2000s. Discover Croatia’s population density data on TGM StatBox.
 Pro
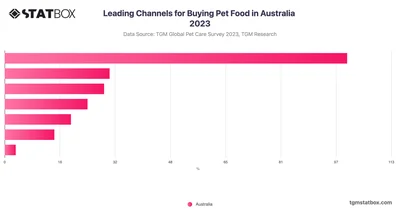
Online platforms account for 19% of pet food purchases in Australia, reflecting the growing reliance on e-commerce for convenience and competitive pricing.
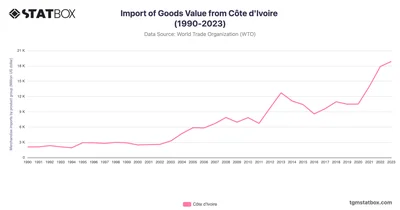
Côte d'Ivoire's imports rose from $2.1B in 1990 to $18.9B in 2023, fueled by industrial and energy needs. Discover more statistics and insights on TGM StatBox.
 Pro
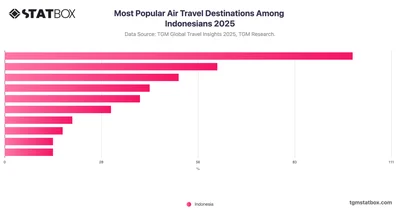
In summer 2025, Southeast Asia remains the top air travel destination among Indonesians, with 36% planning to visit the region. This marks a slight increase from 32% in 2023.