Age-Based Variation in Canadian Christmas Gift Budget Allocation
Gift-giving during the Christmas period represents one of the most significant seasonal expenditure decisions Canadian households make each year. How much individuals allocate to gifts is shaped by a combination of financial capacity, family obligations, and personal priorities, making age a particularly relevant lens through which to examine spending behaviour.
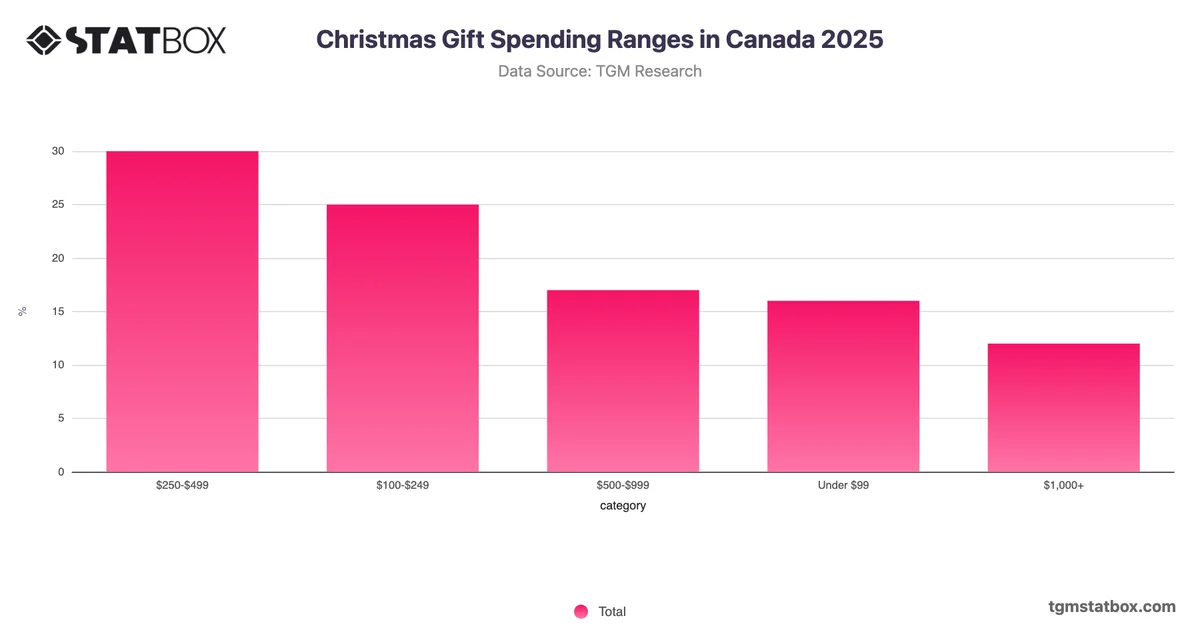
The most analytically notable pattern is the gradual concentration of higher-budget spending among older age groups, which runs counter to assumptions that younger consumers drive peak seasonal expenditure. While 18–24-year-olds are most concentrated in the $250–$499 range at 40%, only 3% spend $1,000 or more. By contrast, 65–75-year-olds reach 16% at the $1,000-plus threshold, the highest of any group, suggesting that discretionary gift budgets expand with age rather than peaking in mid-life. The 35–44 and 55–64 cohorts also index notably higher on premium spending, pointing to life-stage factors such as broader family networks and greater financial stability. For retailers and gift-focused brands, this pattern indicates that premium product positioning and curated high-value gift communications may warrant stronger prioritisation toward consumers aged 45 and above rather than younger demographics.