Gender-Based Divergence in Christmas Gift Budget Distribution
Gift-giving during the Christmas period represents a significant component of household discretionary spending in Canada. Budgeting decisions in this context are shaped by a range of personal, social, and financial considerations, making gender an important lens through which to examine how spending intentions are structured across the population.
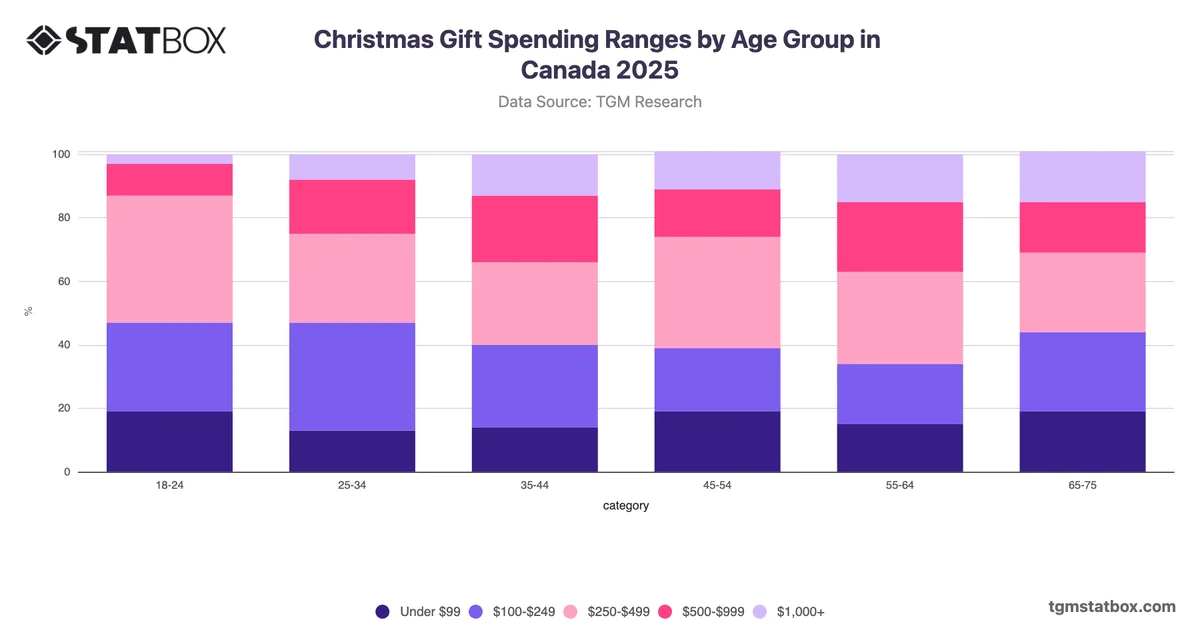
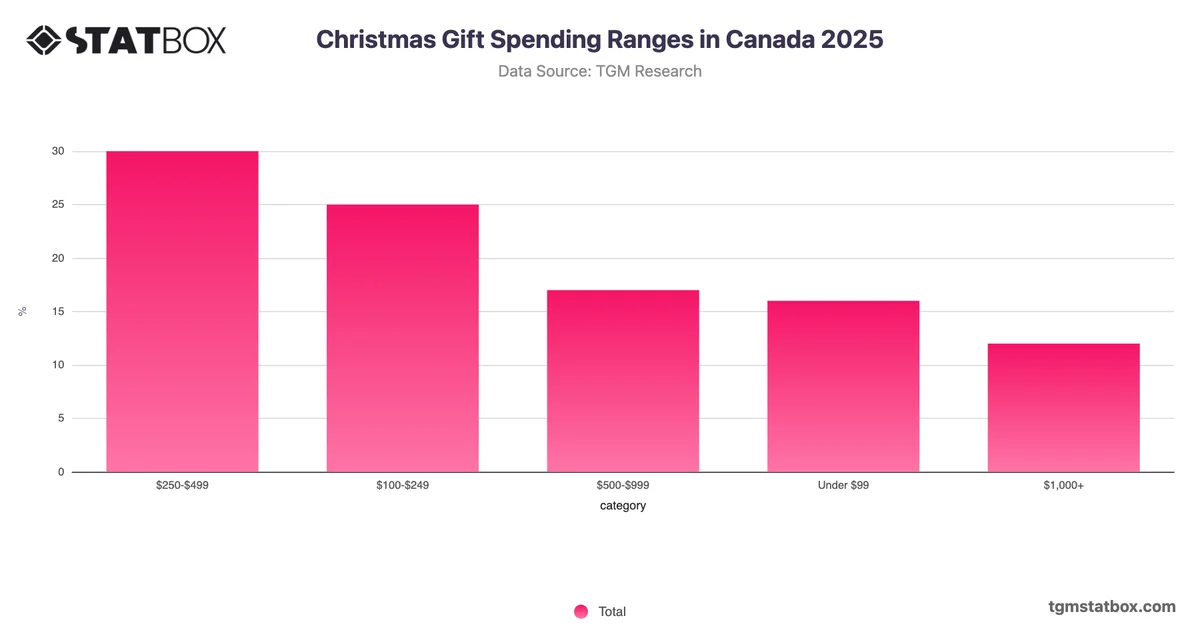
The most notable pattern across male and female respondents is not a uniform gap but rather a divergence at opposite ends of the spending spectrum. Males are more concentrated in the lower mid-range, with 28% allocating $100–$249, and more likely to commit to budgets above $1,000, at 14% compared to 10% among females. Females, by contrast, show stronger concentration in the $250–$999 range, with 51% falling within those brackets versus 43% of males. This suggests that female gift budgets in Canada tend toward moderate but sustained commitment, while male budgets are more polarised between economy and high-end spending. For retailers and campaign planners, this pattern indicates that mid-range product assortments and value messaging may warrant prioritisation in communications directed at female shoppers, while premium or curated gift offerings could be tested more deliberately against a male audience.