Distribution of Canadian Christmas Gift Expenditure Across Spending Tiers
Christmas gift-giving represents one of the most significant seasonal expenditure events for households, encompassing purchases across a wide range of categories including toys, electronics, apparel, and experiences. The breadth of individual budgets in any given market reflects the diversity of household circumstances, gifting obligations, and personal priorities that shape seasonal spending decisions.
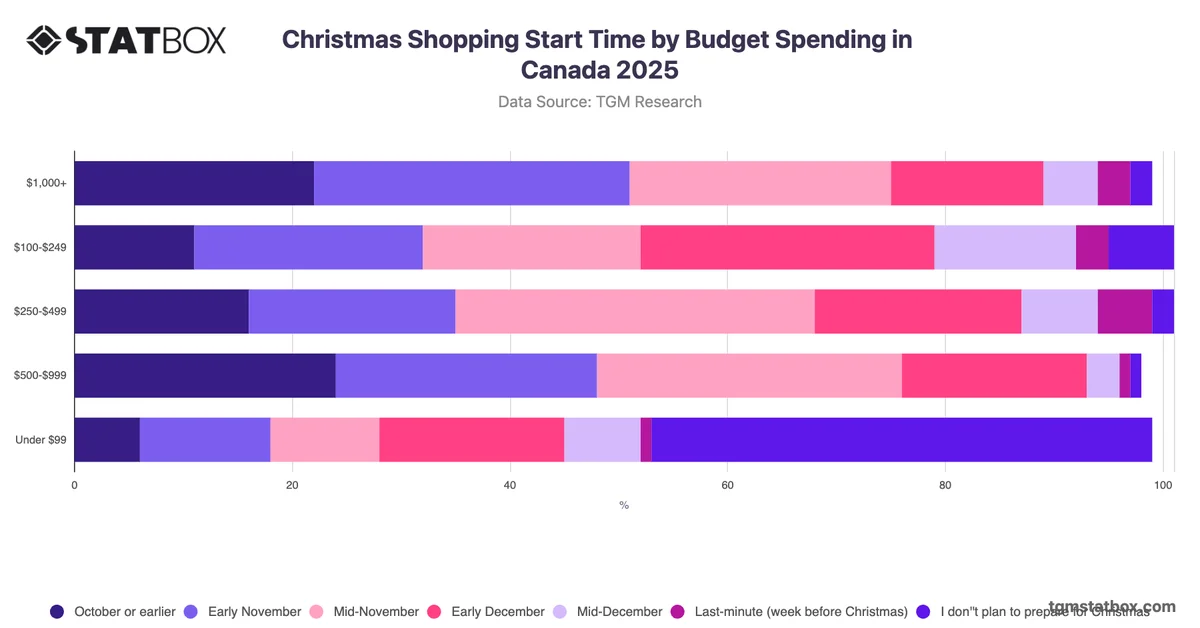
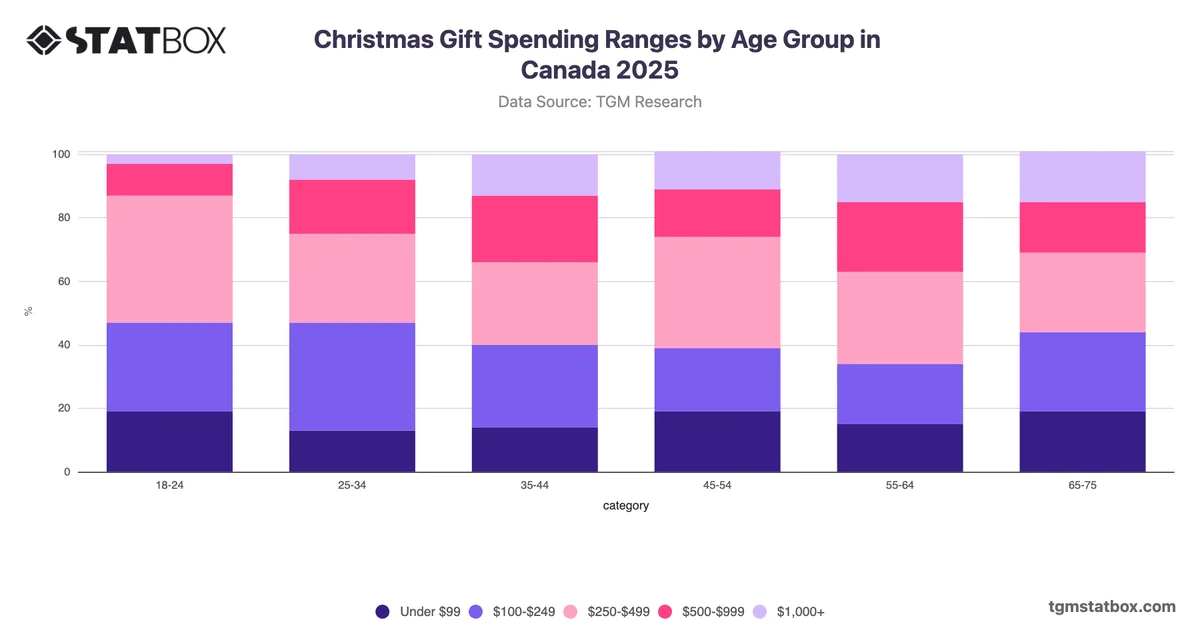
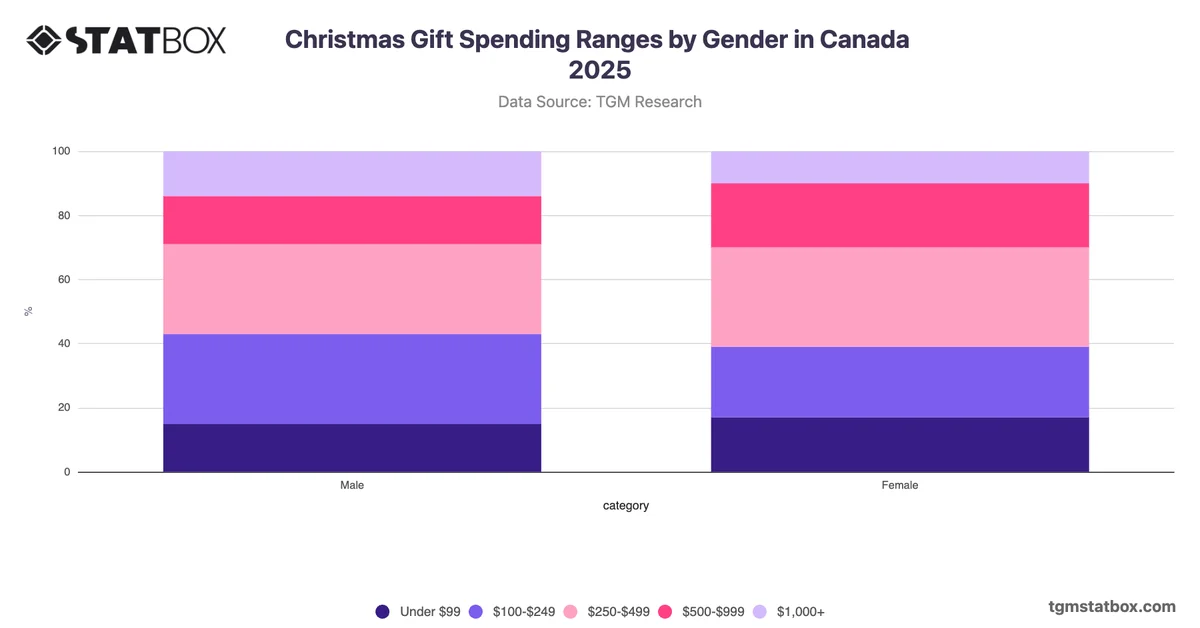
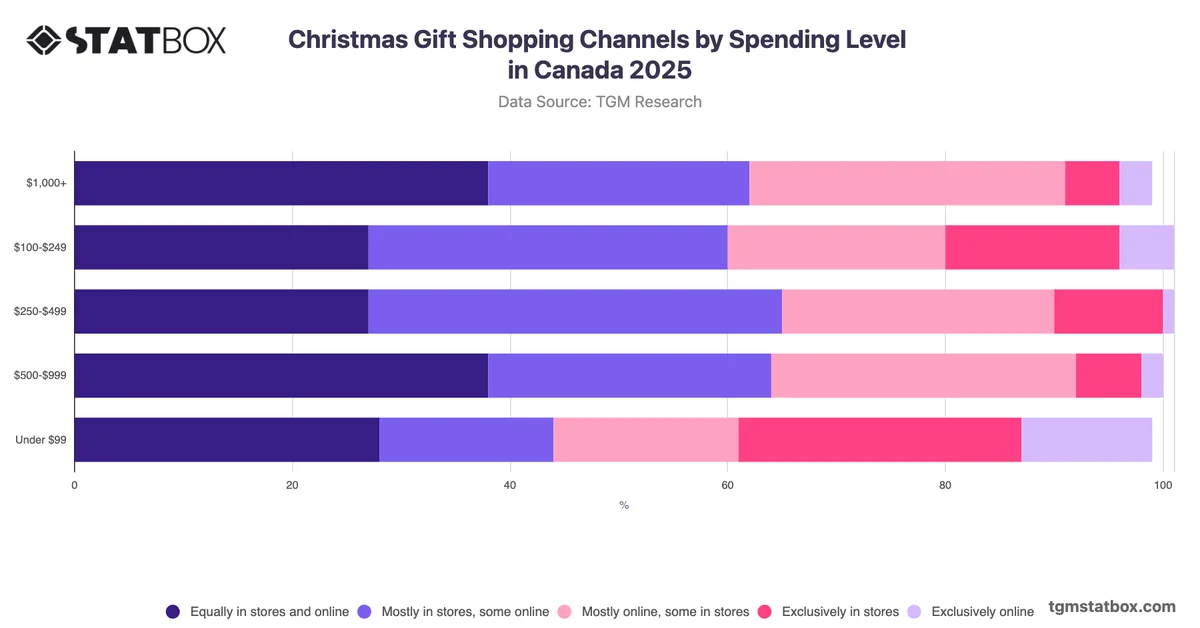
The most notable pattern in Canadian Christmas gift spending is the concentration in the mid-range tier, with the $250–$499 bracket accounting for the largest single share at 30%. Rather than a polarised split between low and high spenders, the distribution forms a moderate peak in the middle, with spending tapering at both extremes. Notably, the combined share of those spending $500 or more reaches 29%, nearly matching the mid-range tier, which indicates a meaningful segment of households committing to substantial seasonal budgets. At the lower end, 16% spend under $99, suggesting a smaller but distinct cost-conscious group. This pattern points to a market without a single dominant spending norm, which may signal that retailers and brands would benefit from testing tiered gift propositions, particularly by developing clearly differentiated product or bundle offerings that serve both the $250–$499 core and the high-value segment above $500.