Price Sensitivity and Quality Priorities Across Canadian Spending Tiers
Christmas shopping decisions involve a complex interplay of financial constraints, personal values, and perceived product worth. For Canadian consumers, the relative weight placed on price, quality, and promotional incentives during the holiday season varies considerably depending on how much individuals plan to spend overall.
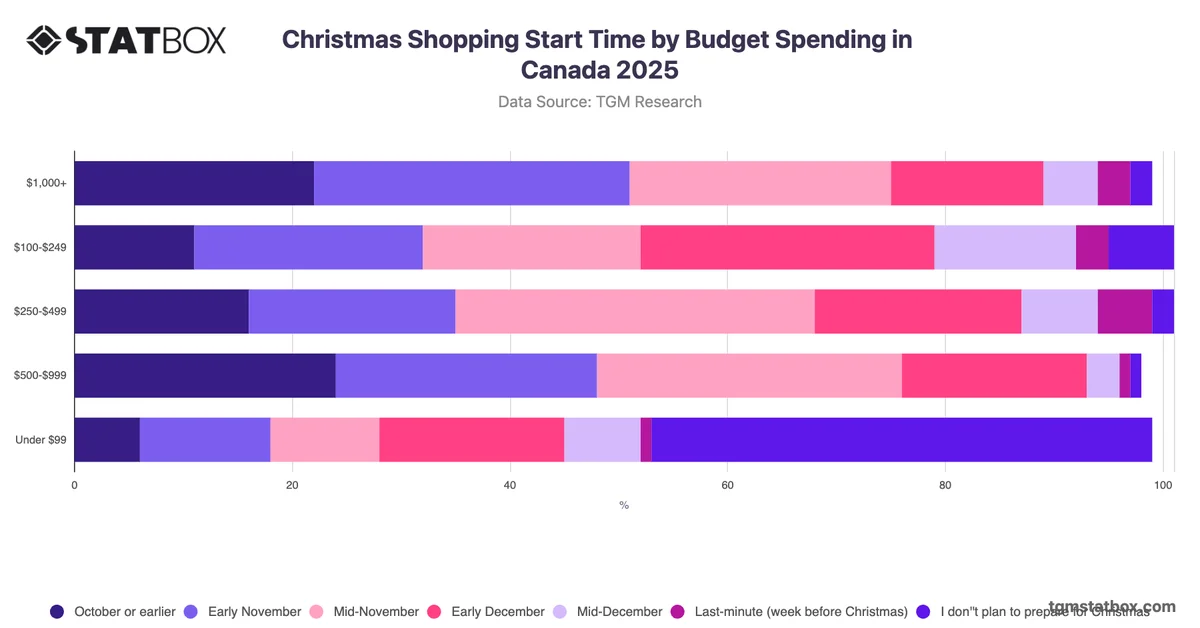
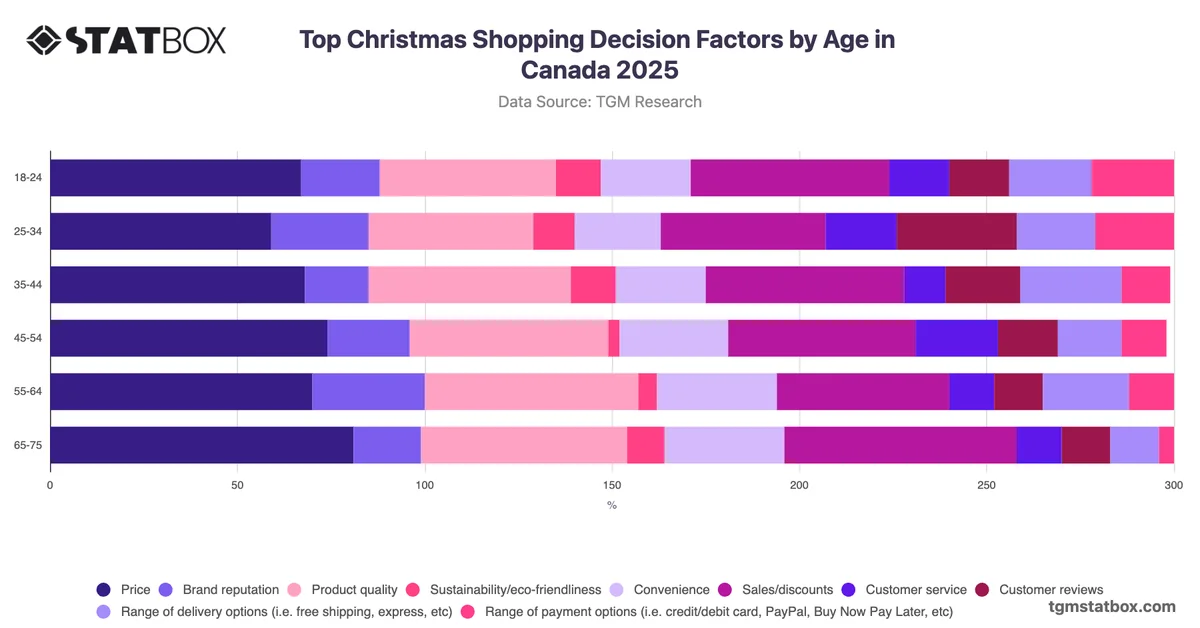
The most analytically significant pattern across spending tiers is the inverse relationship between budget size and price sensitivity, paired with a notable strengthening of product quality as a priority among higher spenders. Among those spending under $99, price is cited by 80%, compared with 64% among those spending $1,000 or more, a 16-percentage-point gap that indicates tighter budgets compress decision criteria toward cost alone. Conversely, product quality rises to 60% among the highest spenders, well above the 47% recorded at the lowest tier. Sales and discounts remain consistently prominent across all groups, suggesting promotional mechanics retain relevance regardless of budget level. Retailers targeting higher-spending Canadian consumers may find greater traction by positioning on quality and value assurance rather than price-led messaging, while promotional strategies remain broadly applicable across all segments.