Chart

Christmas Shopping Start Time by Holiday Spending Budget in USA 2025

Christmas Shopping Start Time by Holiday Spending Budget in USA 2025

Share the statistic on social media channels or embed the statistic in your website using "Embed Code", where available.

Share chart

Embed chart
Select Citation

Cite this statistic and select one of the following formats: APA, Chicago, Harvard, MLA & Bluebook


  • APA
  • Chicago
  • Harvard
  • MLA
  • Bluebook
  • IEEE
TGM StatBox. (2026). Christmas Shopping Start Time by Holiday Spending Budget in USA 2025. TGM StatBox.
Insights

Key Takeaways

Budget-Linked Variation in Christmas Shopping Timing in the USA

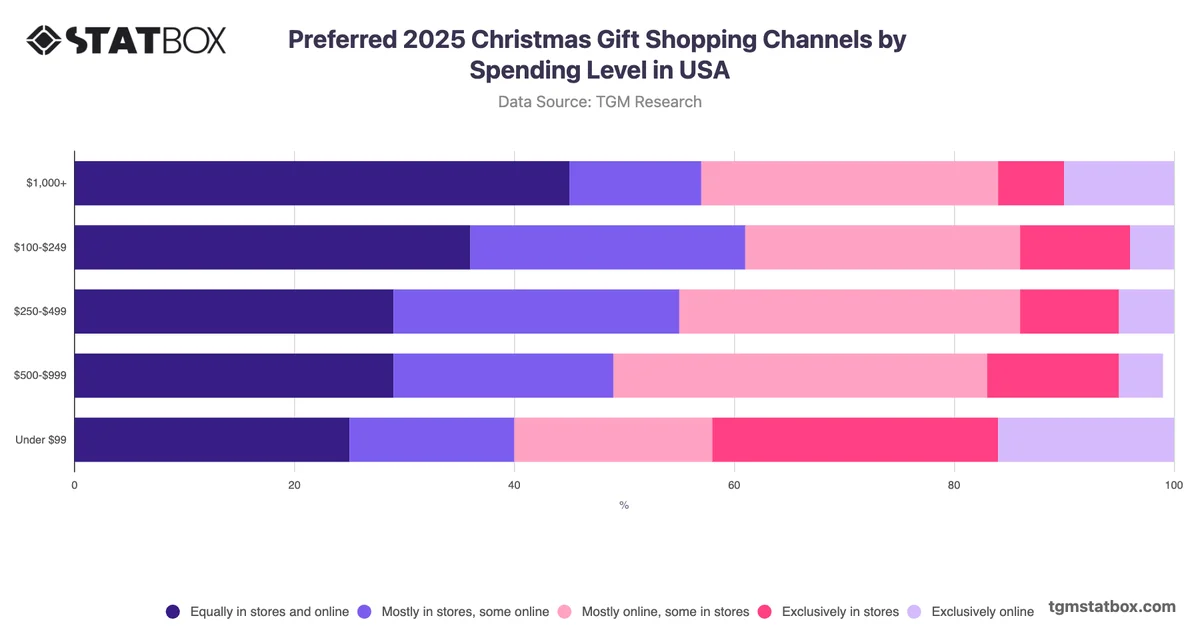
Holiday spending decisions are closely tied to financial planning, with higher-budget consumers typically requiring more time to research, compare, and purchase across multiple categories. The timing of Christmas shopping is therefore not uniform across the population, as budget size shapes when consumers feel ready to begin.

The most analytically significant pattern here is the sharp polarisation between the lowest and highest spending groups. Nearly half of those budgeting under $99 do not plan to participate in Christmas shopping at all, a proportion far exceeding any other group. Among those who do shop, early planning is strongly associated with higher budgets: combined, shoppers spending $500 or more are notably concentrated in October or early November windows, while mid-November attracts a broader share of mid-range spenders in the $100–$499 range. Last-minute shopping remains marginal across all budget tiers. These patterns suggest that retailers targeting higher-value customers should prioritise pre-November activation strategies, while communications aimed at lower-budget segments may need to address participation barriers before timing considerations become relevant.

AI-powered chart insight: This summary is automatically generated to help you understand the chart at a glance. It is intended as an overview; view the full chart and underlying data for complete context.

Related report

Would You Like to Know More?
Explore Our USA Report

Charts library

Further Recommended USA Statistics

Statbox vector
The briefing
New data, in your inbox

Consumer insights, data stories and product updates as we publish them. No other mail, and one click to leave.

Roughly two emails a month.

Research services
Have a question our newsroom hasn't answered? Ask it directly.

Our team can run the study behind the story — in 60+ countries, on your question, with the data belonging to you.