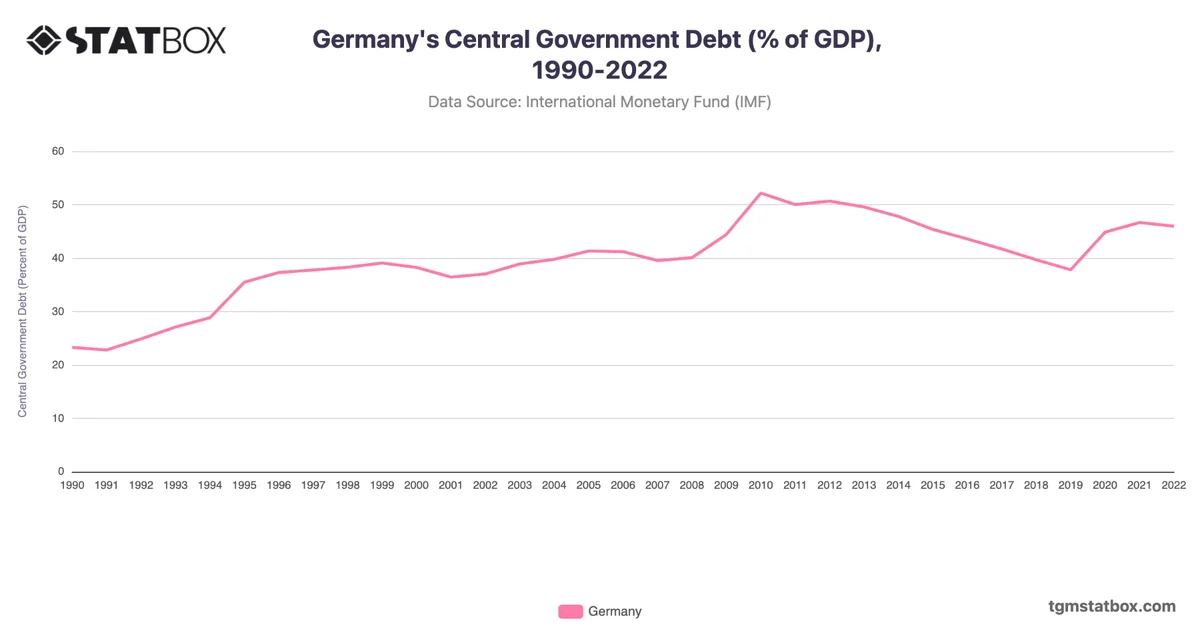
Germany's government debt saw significant changes from 1990 onward, starting with a stable period in the early 1990s, with debt at around 40.9% in 1990. Debt levels increased gradually through the early 2000s, reaching 67.5% by 2005 due to reunification costs and welfare spending. The 2008 financial crisis prompted another rise, peaking at 82.0% in 2010.
Post-crisis, Germany focused on fiscal consolidation, reducing debt to 58.9% by 2019 through budget surpluses and a stable economy. However, the COVID-19 pandemic caused an increase to 68.0% in 2020, with a slight decline to 66.5% by 2022 as the economy began to recover.
Post-crisis, Germany focused on fiscal consolidation, reducing debt to 58.9% by 2019 through budget surpluses and a stable economy. However, the COVID-19 pandemic caused an increase to 68.0% in 2020, with a slight decline to 66.5% by 2022 as the economy began to recover.
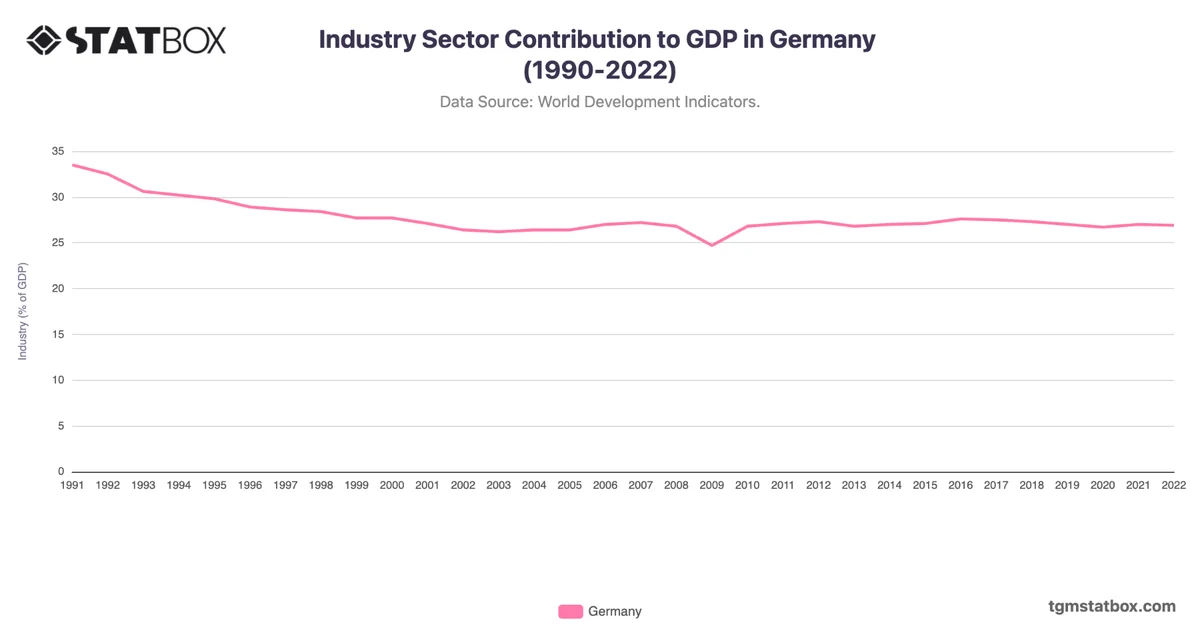
Find out more through related statistics on Germany’s population numbers, Germany’s industry sector’s GDP contribution, Germany’s national debt ratio.