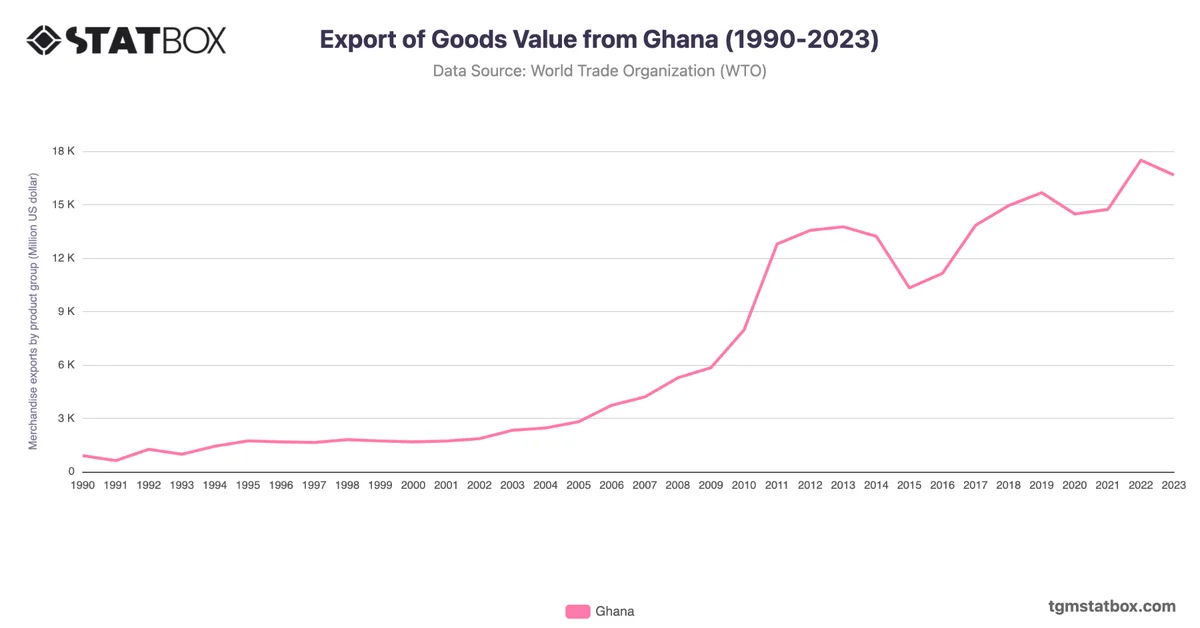
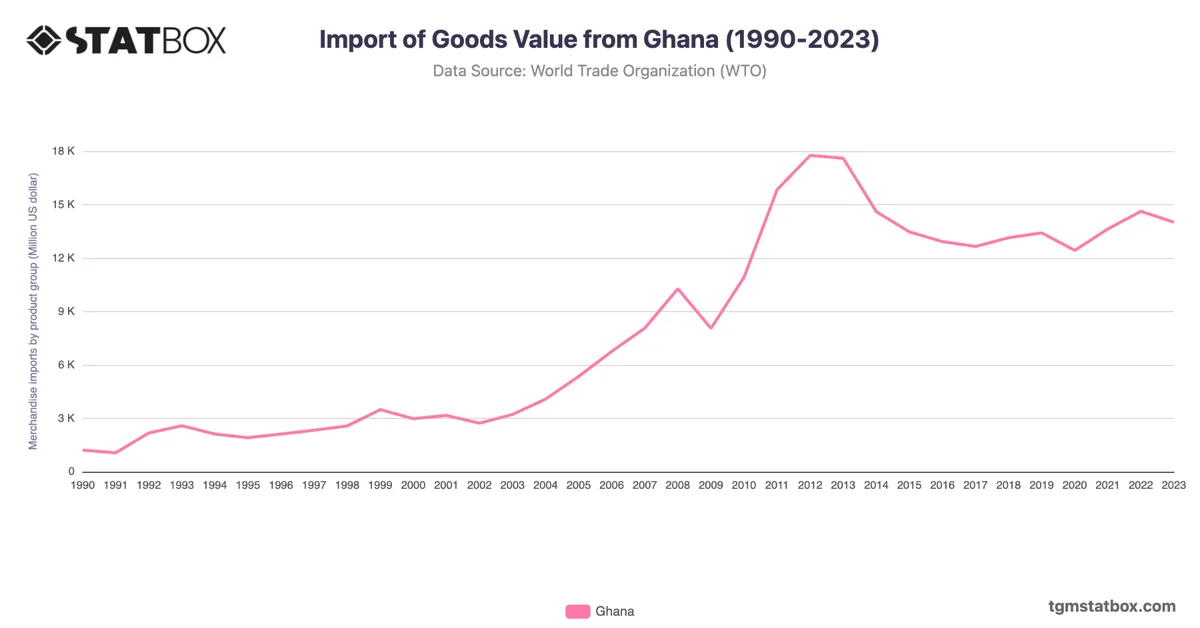
Ghana’s trade balance of goods remained in surplus over the 2017–2023 period, reflecting its export-driven economy. The balance peaked at 2,872.8 million USD in 2022, supported by robust exports of gold, cocoa, and oil. However, the surplus narrowed to 2,153.3 million USD in 2023, likely due to fluctuations in global commodity prices and rising import costs.
Despite these fluctuations, Ghana's trade performance highlights its reliance on primary commodity exports, making it vulnerable to global market trends. To sustain its surplus, diversification into value-added exports and reduced import dependency will be key priorities moving forward.
Despite these fluctuations, Ghana's trade performance highlights its reliance on primary commodity exports, making it vulnerable to global market trends. To sustain its surplus, diversification into value-added exports and reduced import dependency will be key priorities moving forward.
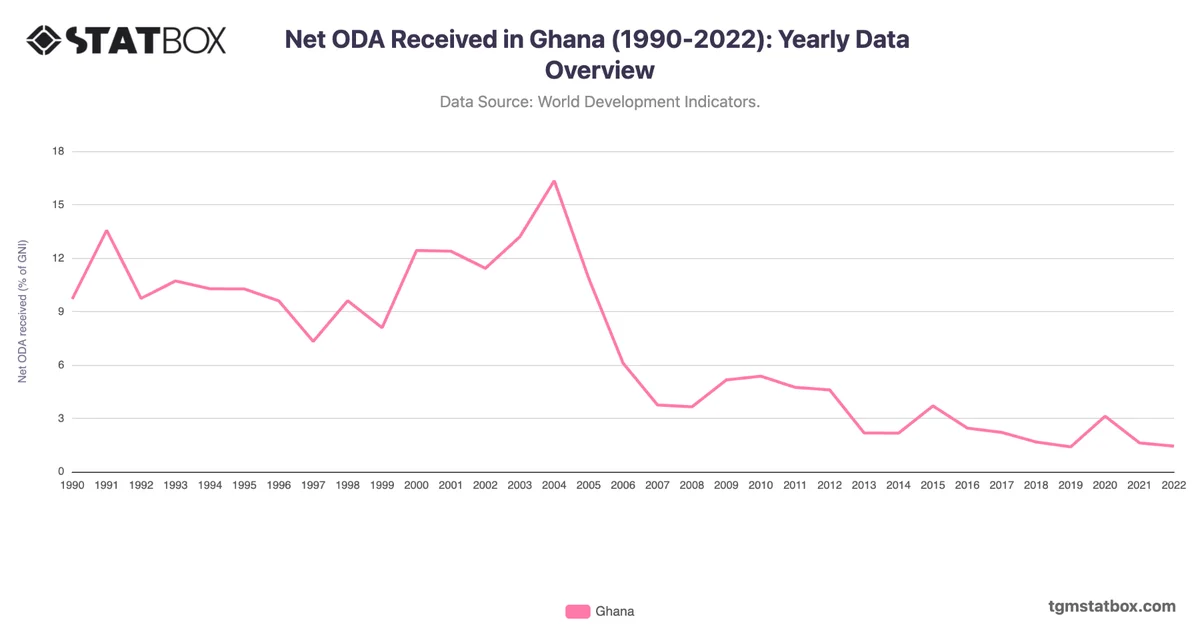
For a deeper dive into the topic, explore Ghana’s military personnel history, Ghana’s yearly net ODA data, Ghana’s goods export value.