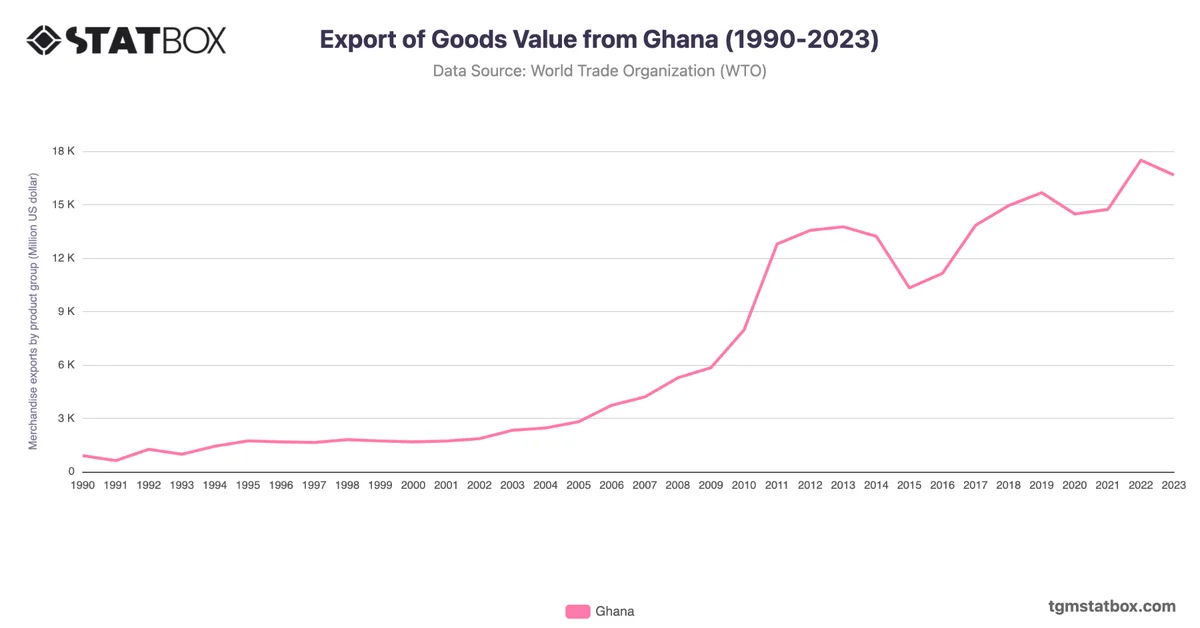
Ghana’s imports have steadily risen from $1.2B in 1990 to $14.6B in 2022, showcasing its economic growth and increased reliance on external goods. The period from 2005 to 2008 saw notable growth, with imports rising from $5.3B to $10.2B, fueled by investments in infrastructure and growing demand for industrial goods.
After peaking at $17.7B in 2012, imports declined due to economic challenges and currency depreciation. Recent years, including $14.6B in 2022, reflect gradual recovery supported by international trade partnerships and infrastructure development. Ghana’s import trends highlight its growing economy and the importance of trade in supporting industrialization.
After peaking at $17.7B in 2012, imports declined due to economic challenges and currency depreciation. Recent years, including $14.6B in 2022, reflect gradual recovery supported by international trade partnerships and infrastructure development. Ghana’s import trends highlight its growing economy and the importance of trade in supporting industrialization.
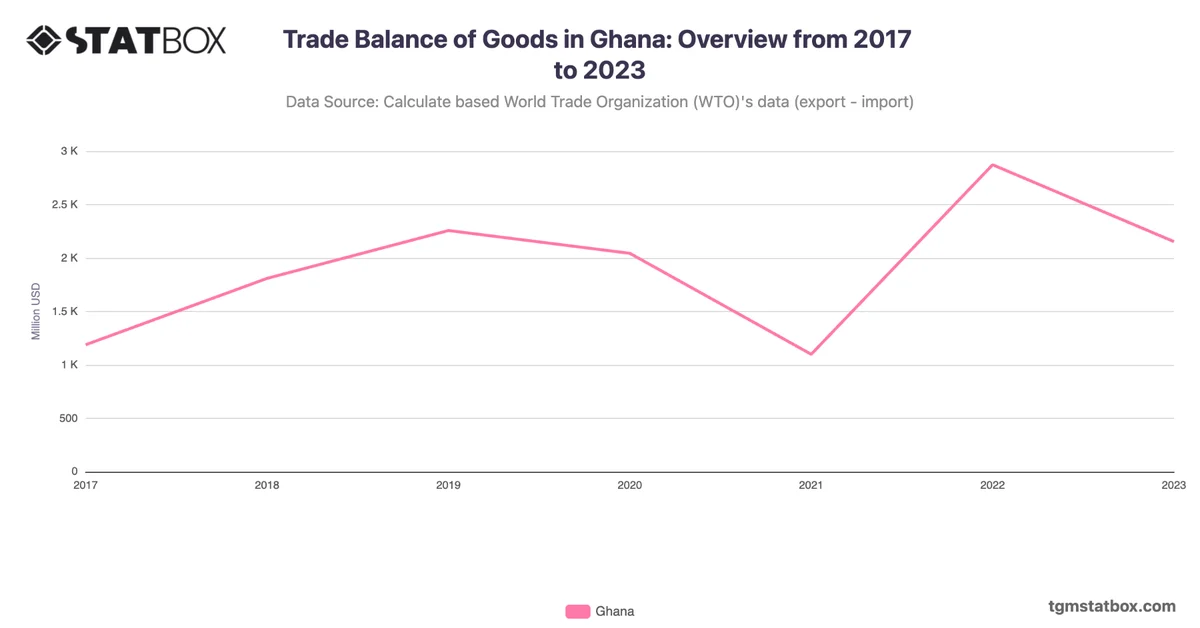
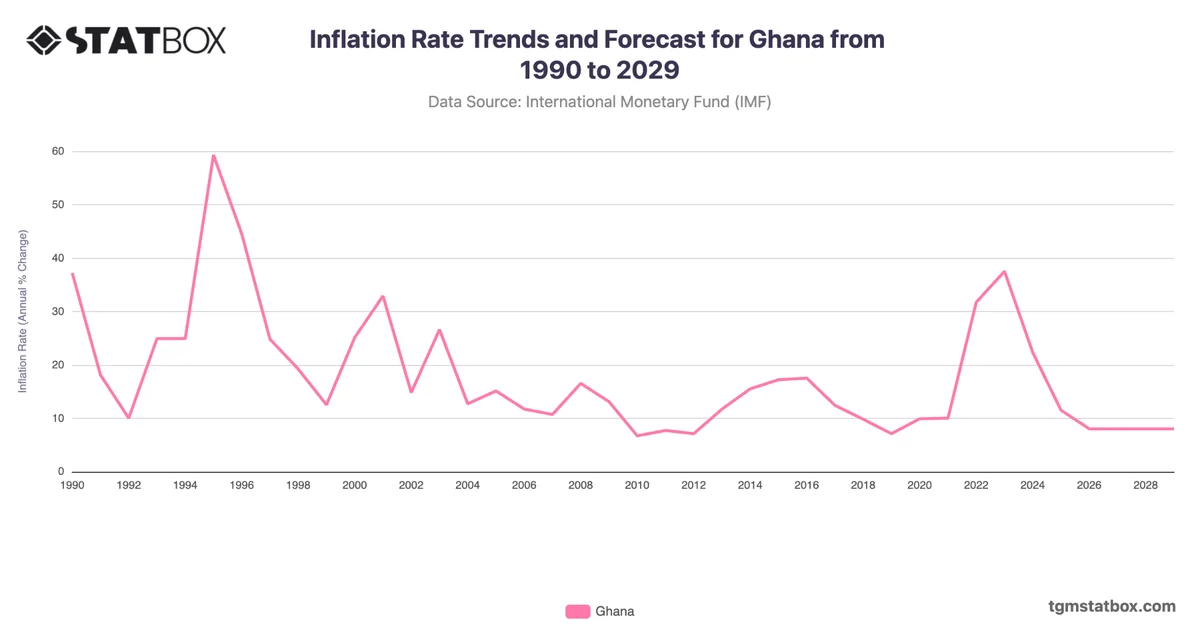
For additional information, visit statistics on Ghana’s goods trade balance, Ghana’s unemployment rate trend, Ghana’s inflation trends.