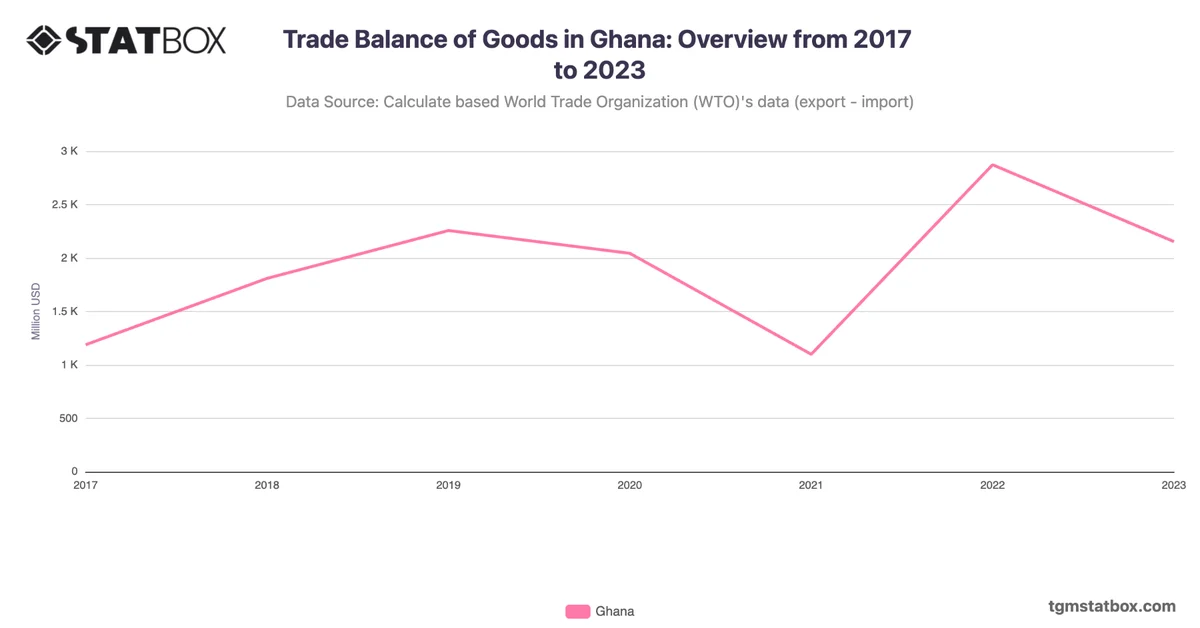
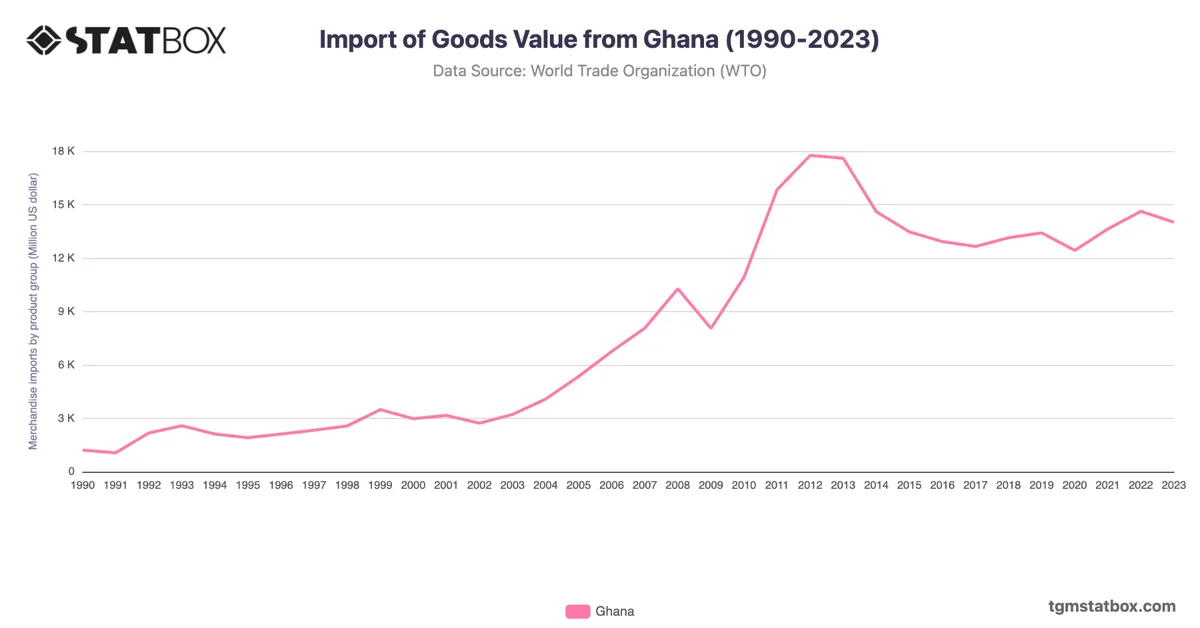
Ghana's export values expanded from $897 million in 1990 to $16.6 billion in 2023, reflecting the country's resource-driven economy. Gold and cocoa were key contributors, particularly in the 1990s and early 2000s. By 2011, exports reached $12.7 billion, bolstered by the discovery and export of oil.
Challenges in global commodity prices caused dips, notably in 2015 and 2020. However, recovery was evident post-2021, with exports rising to $17.4 billion in 2022, driven by higher gold prices and increased oil production. The slight dip in 2023 indicates potential pressures from global market conditions.
Challenges in global commodity prices caused dips, notably in 2015 and 2020. However, recovery was evident post-2021, with exports rising to $17.4 billion in 2022, driven by higher gold prices and increased oil production. The slight dip in 2023 indicates potential pressures from global market conditions.
For a deeper dive into the topic, explore Ghana’s services sector share in GDP, Ghana’s annual GDP figures, Ghana’s population numbers.