India's Central Government Debt (% of GDP), 1990-2022

India's Central Government Debt (% of GDP), 1990-2022

Share the statistic on social media channels or embed the statistic in your website using "Embed Code", where available.

Share chart

Embed chart
Select Citation

Cite this statistic and select one of the following formats: APA, Chicago, Harvard, MLA & Bluebook


  • APA
  • Chicago
  • Harvard
  • MLA
  • Bluebook
  • IEEE
TGM StatBox. (2024). India's Central Government Debt (% of GDP), 1990-2022. TGM StatBox.
Chart Details
Timeframe: 1990-2022
Country: India
Published date: 2024
Survey Question: The Central Government Debt (Percent of GDP) by the International Monetary Fund (IMF) refers to the total debt owed by a country's central government as a percentage of its Gross Domestic Product (GDP).
Key Takeaways
India’s central government debt fluctuated significantly over the decades, starting at 49.9% of GDP in 1990. Debt dropped to 42.09% in 1992 after economic reforms but spiked to 59.82% in 2002 due to fiscal expansion.

Post-2003, debt declined gradually, reaching 44.13% in 2018. However, the pandemic caused a notable increase, with debt standing at 55.45% in 2022, reflecting pandemic-related expenditures and slowed economic growth.

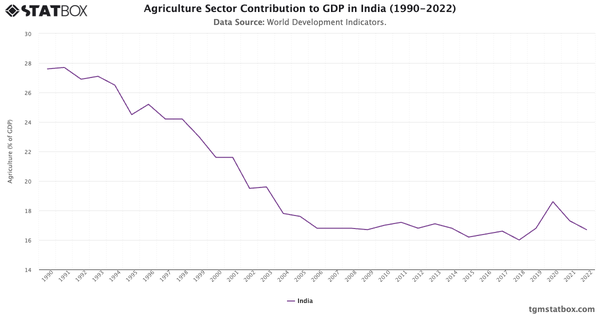
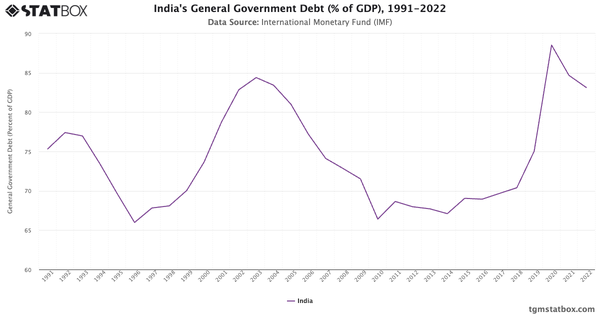
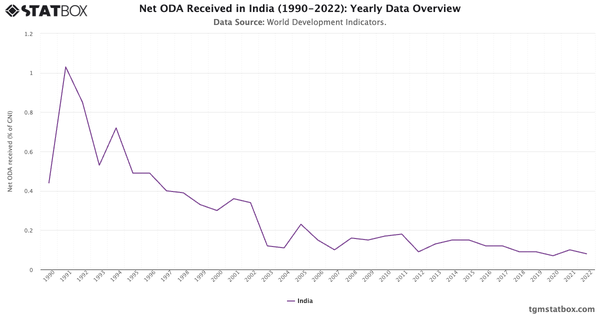
Gain a broader perspective by reviewing India’s net ODA annual share, industry sector’s GDP share in India, India’s government debt share in GDP.

Would you like to know more?
Check our report on this topic

Sustainability Report: Insights in India

India Sustainability Insights Report 2024

Sustainability Report: Insights in India

Discover how people in India think and act on sustainability. TGM delivers localized, data-driven insights to support responsible business decisions and global impact.

Go to report

Further Recommended Statistics

Statbox vector
Statbox |form contact icon

Have Other Queries?

Statbox vector

Connect with our expert team for immediate assistance or comprehensive market analysis. We are always ready to support your business needs.