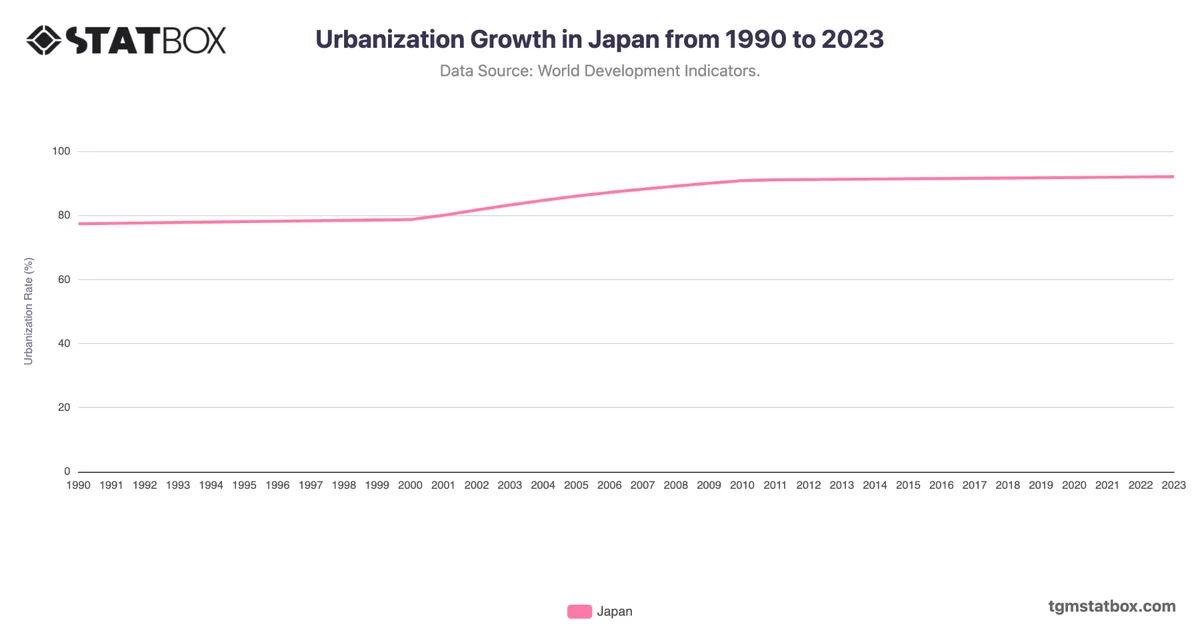
Japan's population density saw a gradual increase from 1990 to the early 2000s, peaking around 351 people per square kilometer from 2005 to 2010. This growth reflects Japan's high urbanization rate and the migration toward major cities, notably Tokyo, Osaka, and Nagoya, which concentrate a significant portion of the population in relatively limited urban areas. Japan’s limited arable land has historically pushed the population toward dense, urbanized regions, creating one of the world’s most urban-centric societies.
After 2010, the population density slightly decreased, reaching 345 by 2021. This decline aligns with Japan’s aging population and low birth rate, which have contributed to a gradual decrease in total population. The country's stringent immigration policies have also limited population growth, reinforcing this downward trend. Japan’s population density trends underscore both its urbanization patterns and the demographic challenges it faces.
After 2010, the population density slightly decreased, reaching 345 by 2021. This decline aligns with Japan’s aging population and low birth rate, which have contributed to a gradual decrease in total population. The country's stringent immigration policies have also limited population growth, reinforcing this downward trend. Japan’s population density trends underscore both its urbanization patterns and the demographic challenges it faces.
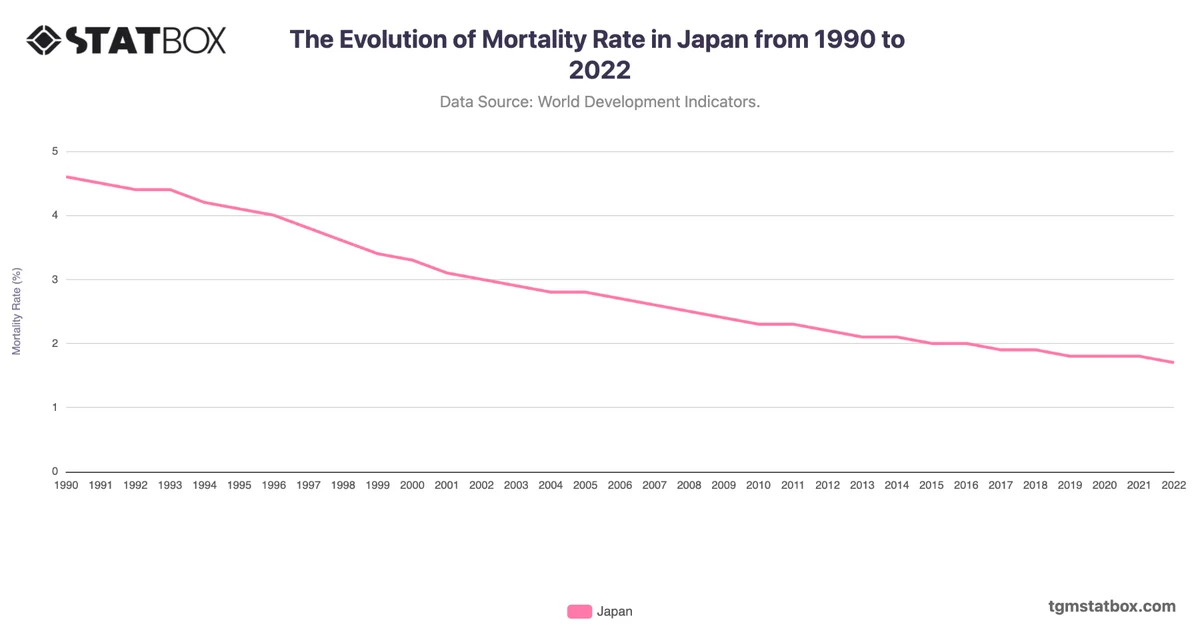
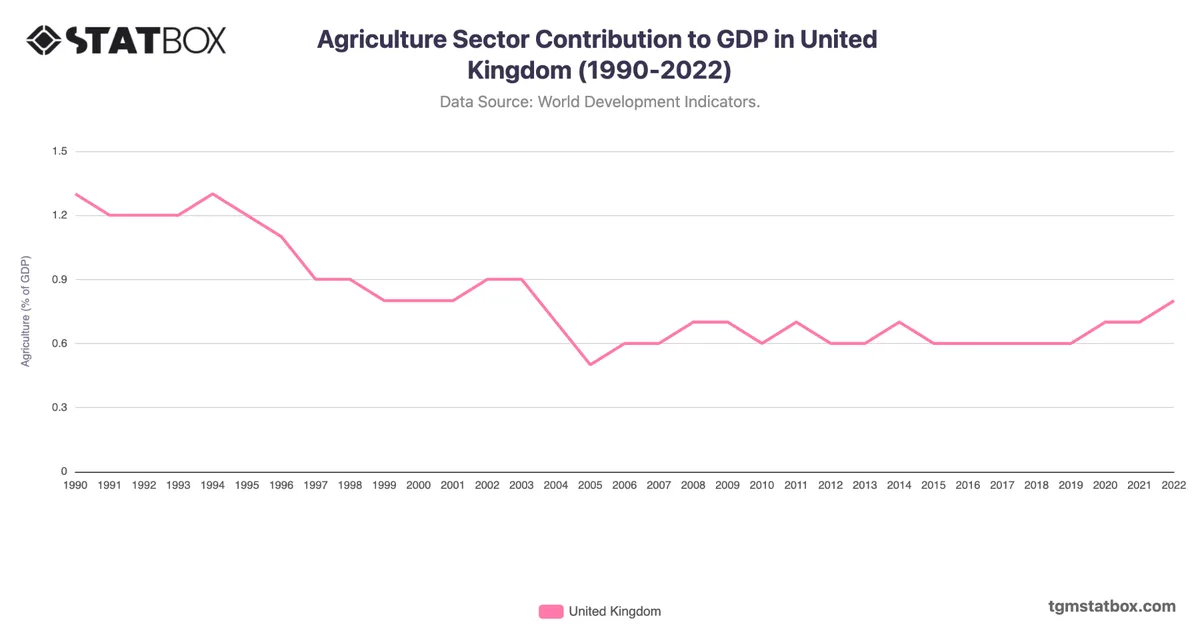
Explore related charts to gain a better understanding of Japan’s agriculture sector share in GDP, shifting median age in Japan, Japan’s mortality rate trend.