Kenya’s Net ODA (% of GNI) peaked at 17.0% in 1993, driven by international support during political transitions and economic stabilization efforts following the end of the Cold War. Aid levels declined steadily thereafter, reaching 2.4% in 2022, reflecting Kenya’s improved governance and economic growth.
Periodic spikes, such as in 2011 (5.9%), align with humanitarian crises, including droughts and famine, which necessitated emergency international assistance. The overall downward trend indicates Kenya’s progression toward self-reliance while still benefiting from targeted donor programs for infrastructure and healthcare.
Periodic spikes, such as in 2011 (5.9%), align with humanitarian crises, including droughts and famine, which necessitated emergency international assistance. The overall downward trend indicates Kenya’s progression toward self-reliance while still benefiting from targeted donor programs for infrastructure and healthcare.
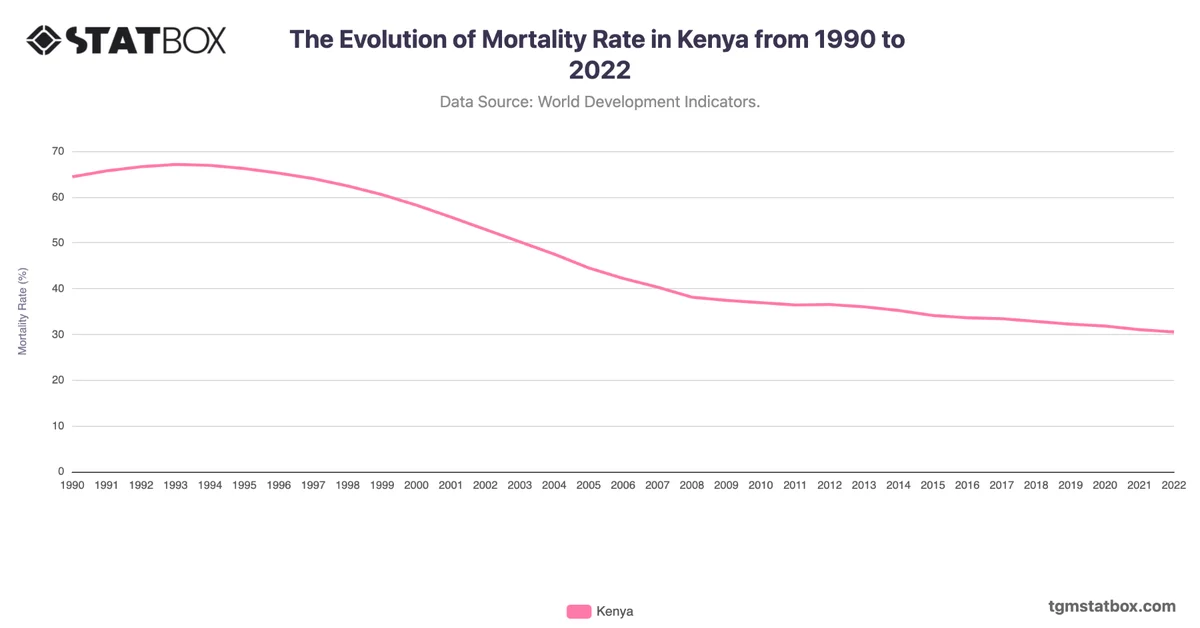
Gain a broader perspective by reviewing Kenya’s mortality rate changes, Kenya’s defense spending, Kenya’s agricultural share in GDP.