Egypt's military spending reached its zenith in the late 1960s and early 1970s, peaking at 17.3% of GDP in 1974, reflecting heavy expenditures during the Arab-Israeli conflicts. Following the peace treaty with Israel in 1979, expenditures began a steady decline, falling to around 6.5% by 1979 and further to 3.5% in 1990.
The 21st century saw continued reductions, with spending stabilizing at approximately 1.1% by 2020. This decline highlights Egypt's economic focus on infrastructure development and modernization, alongside reduced external military engagements.
The 21st century saw continued reductions, with spending stabilizing at approximately 1.1% by 2020. This decline highlights Egypt's economic focus on infrastructure development and modernization, alongside reduced external military engagements.
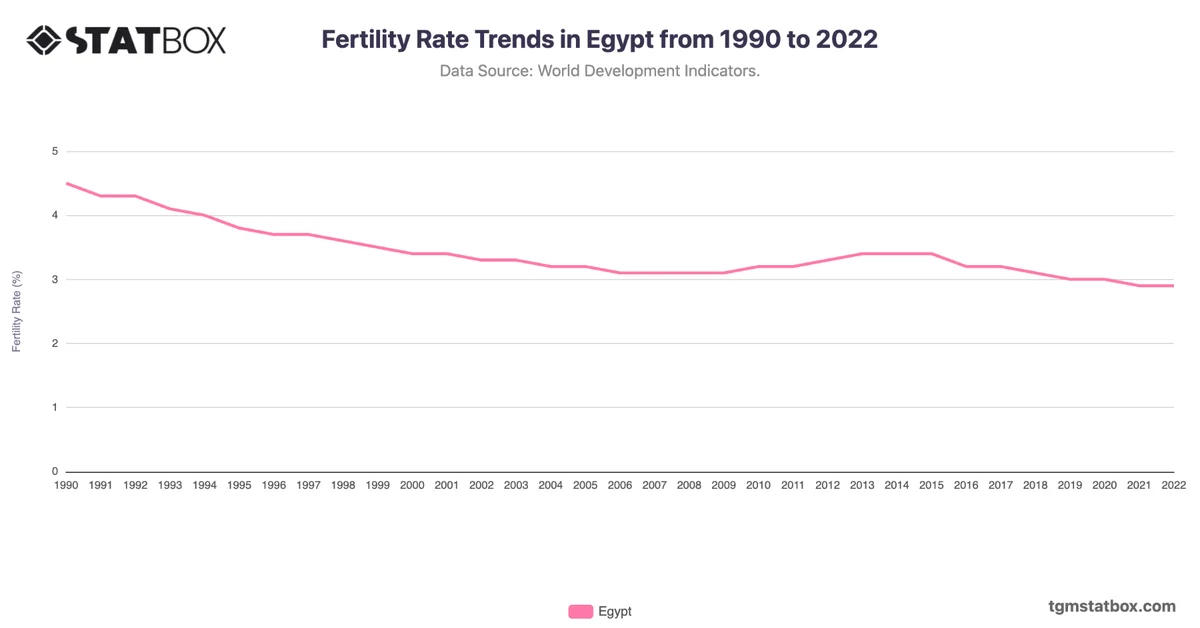
Discover additional trends and data on Egypt’s military personnel numbers, Egypt’s agriculture share in GDP, Egypt’s fertility rate trends.