Gender-Based Divergence in Christmas Gift Spending Intensity
Gift-giving during the Christmas period represents a significant area of planned household expenditure, with consumers making deliberate budgetary decisions across a range of spending tiers. Gender can be a meaningful variable in how individuals approach and prioritise discretionary seasonal spending, making it a relevant dimension for understanding consumer financial commitment during the holiday period.
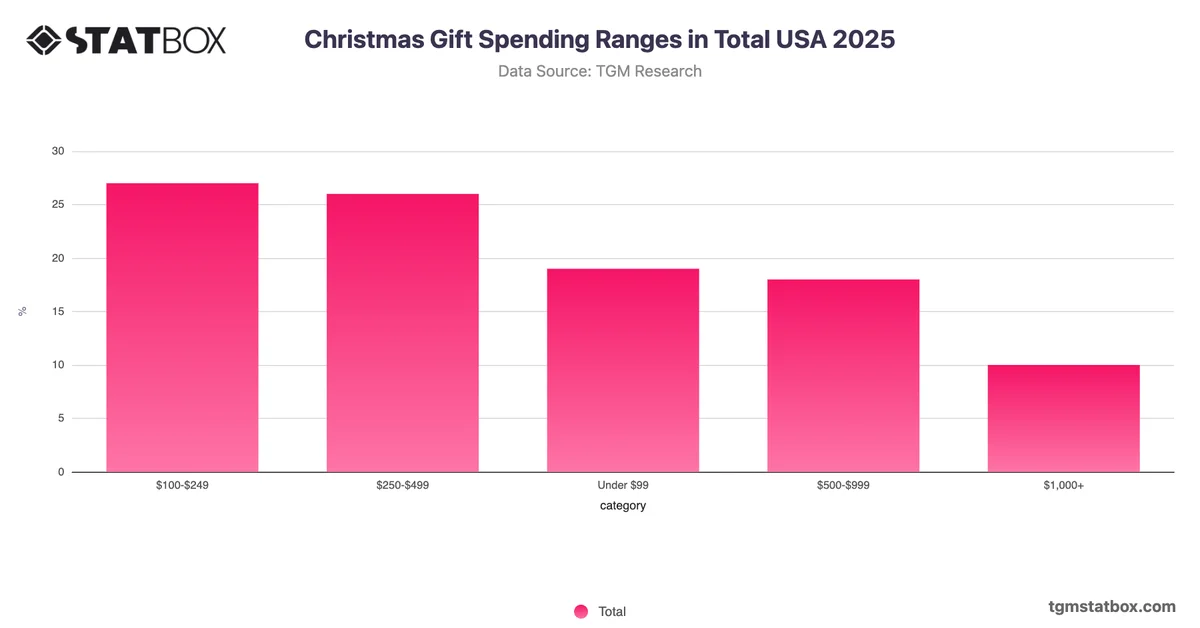
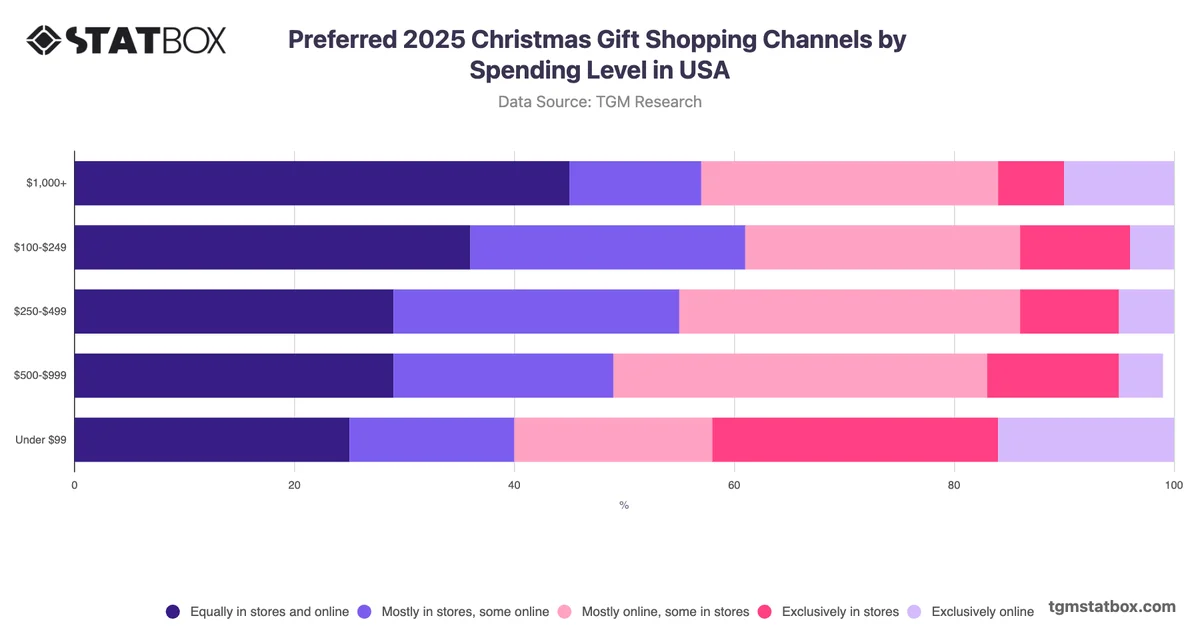
The most analytically significant contrast between male and female respondents lies at the upper end of the spending spectrum. Male respondents are more than twice as likely as females to budget $1,000 or more for Christmas gifts, at 14% compared to 6%, pointing to a meaningful gender gap in high-value spending intent rather than in mid-range budgeting, where the two groups are broadly comparable. Across the $100 to $999 range, the distribution is relatively balanced, suggesting that divergence is concentrated at the extremes. Female respondents are modestly more likely to remain under $99. This pattern indicates that gender-based segmentation may be most commercially relevant at premium spending tiers rather than across the full budget range. Retailers and brands targeting high-spend Christmas shoppers may find it worthwhile to investigate whether product category, gifting occasion, or household role accounts for the disproportionate male concentration at the $1,000-plus threshold.