Share the statistic on social media channels or embed the statistic in your website using "Embed Code", where available.
Share chart
Embed chart Embed copied!Cite this statistic and select one of the following formats: APA, Chicago, Harvard, MLA & Bluebook
Data is based on traffic from Apr-22 to Jun-22.
Key Takeaways
The Philippines demonstrates a strong preference for mobile devices, with 70.91% of users opting for this platform. The 27.25% computer usage shows that while mobile is dominant, computers still play a critical role, particularly in professional settings. The 1.84% tablet usage indicates a limited market for tablets compared to other devices.
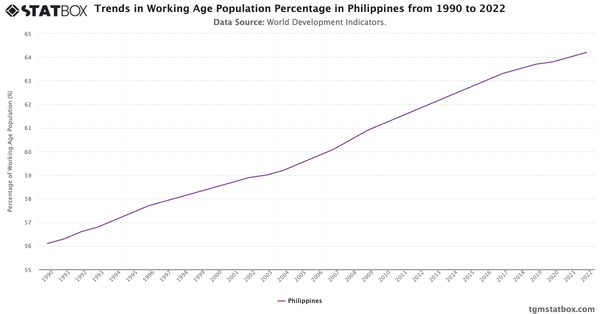
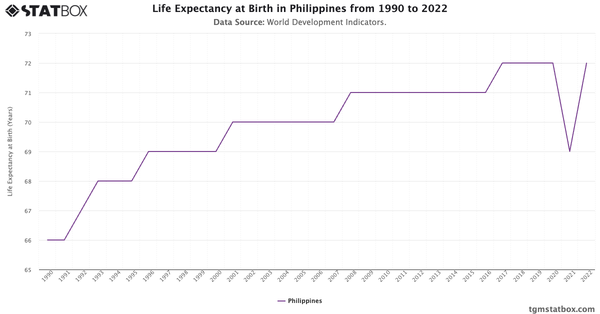
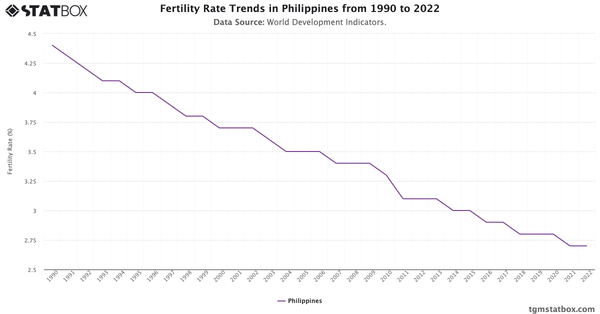
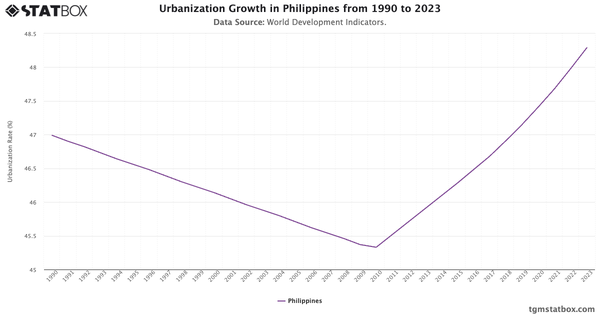
For a broader context, visit other statistics on Annual net ODA for the Philippines, Philippines’ birth longevity, Philippines’ urbanization trend.

Philippines Sustainability Insights Report 2024
Learn more about sustainability insights in Philippines with TGM StatBox. Explore in-depth insight report, featuring user behavior, trends, and preferences.
Go to report


Connect with our expert team for immediate assistance or comprehensive market analysis. We are always ready to support your business needs.