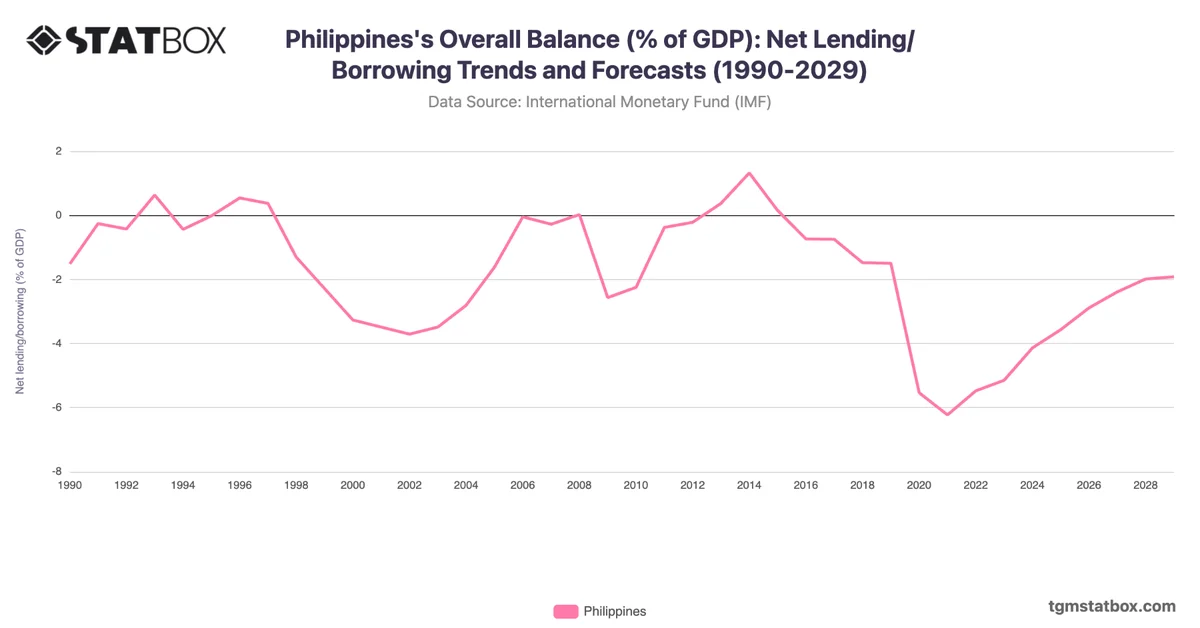
The Philippines experienced a dynamic trend in its government debt-to-GDP ratio from 1990 to 2022, shaped by fiscal policies, economic cycles, and global economic events. In the early 1990s, debt levels gradually declined, dropping from 56.18% in 1990 to 53.91% in 1992. However, a sharp increase occurred in 1993, bringing debt up to 68.60%, partly due to public investments aimed at stabilizing and boosting the economy. Following this peak, debt began to decline again as economic reforms were implemented, with the ratio reaching 50.77% by 1998.
The debt ratio climbed in the early 2000s, reaching a high of 71.39% in 2003 due to increased public spending and a challenging global economic environment. A gradual decline followed, aided by fiscal consolidation efforts and steady economic growth, with the debt-to-GDP ratio decreasing to 50.01% in 2008 and further down to 45.43% by 2011. This downward trend continued, reaching a low of 36.97% by 2019, reflecting disciplined fiscal management and a growing economy.
The onset of the COVID-19 pandemic in 2020 led to a significant rise in the debt ratio, which jumped to 51.64% as the government increased spending on health and economic relief measures. This trend continued into 2021 and 2022, with the debt-to-GDP ratio peaking at 57.52% as the country worked to support recovery efforts. Despite recent increases, the Philippines' debt ratio reflects a careful balancing act between growth-oriented spending and fiscal responsibility.
The debt ratio climbed in the early 2000s, reaching a high of 71.39% in 2003 due to increased public spending and a challenging global economic environment. A gradual decline followed, aided by fiscal consolidation efforts and steady economic growth, with the debt-to-GDP ratio decreasing to 50.01% in 2008 and further down to 45.43% by 2011. This downward trend continued, reaching a low of 36.97% by 2019, reflecting disciplined fiscal management and a growing economy.
The onset of the COVID-19 pandemic in 2020 led to a significant rise in the debt ratio, which jumped to 51.64% as the government increased spending on health and economic relief measures. This trend continued into 2021 and 2022, with the debt-to-GDP ratio peaking at 57.52% as the country worked to support recovery efforts. Despite recent increases, the Philippines' debt ratio reflects a careful balancing act between growth-oriented spending and fiscal responsibility.
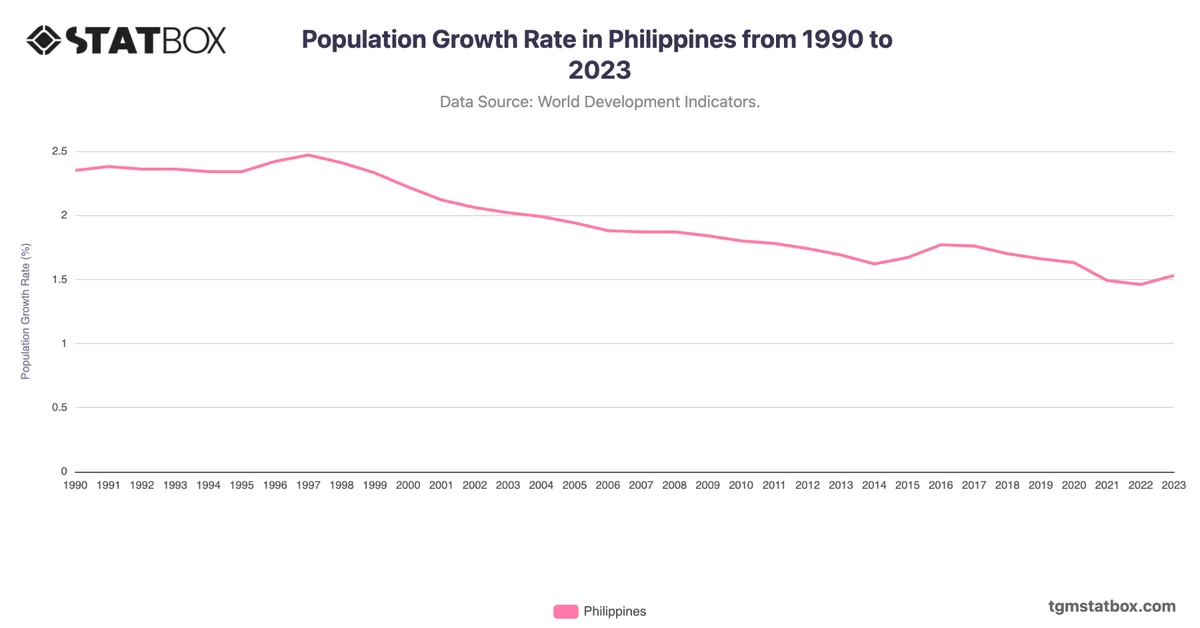
Explore related charts to gain a better understanding of Philippines’ population growth rate, Philippines’ military spending, Philippines’ industry share in GDP.