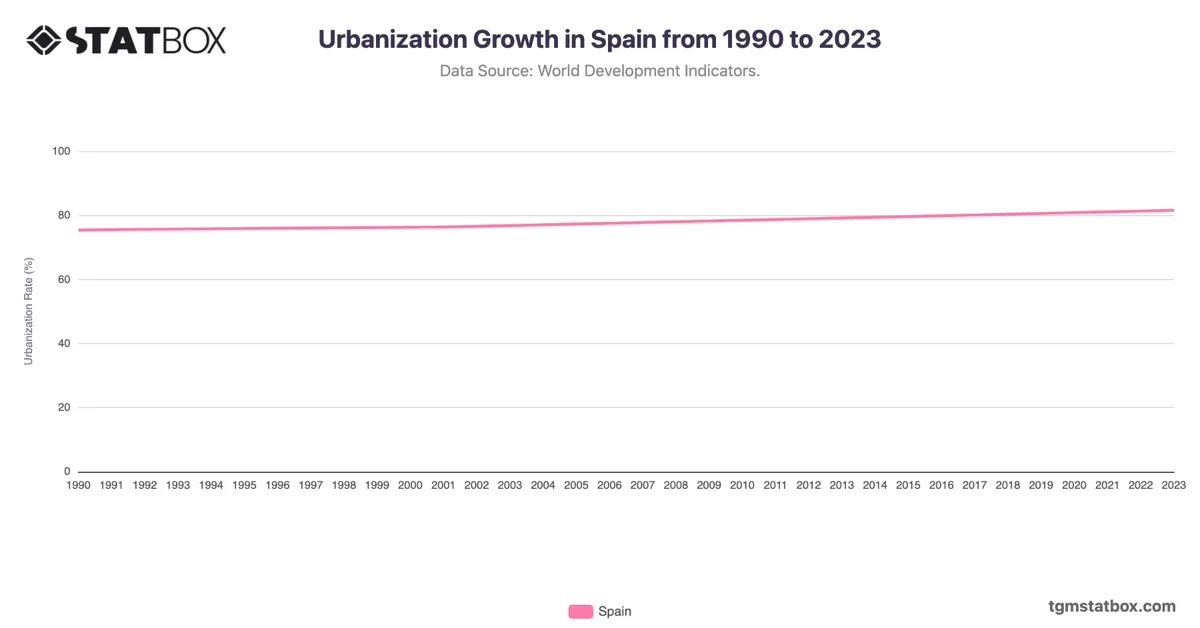
Spain’s population density increased from 78 to 95 people per square kilometer, reflecting moderate growth aligned with urbanization in regions like Madrid and Catalonia. Spain's density growth spiked in the early 2000s, due to economic expansion and immigration. However, by 2013, density growth slowed as Spain experienced economic downturns, affecting migration patterns.
The gradual recovery and urban revitalization in major cities have since supported density stability. Spain’s recent density trends demonstrate urban concentration alongside policies to rejuvenate rural areas, aiming to counterbalance urban-rural density disparities.
The gradual recovery and urban revitalization in major cities have since supported density stability. Spain’s recent density trends demonstrate urban concentration alongside policies to rejuvenate rural areas, aiming to counterbalance urban-rural density disparities.
For a deeper dive into the topic, explore Spain’s urbanization rate, Spain’s mortality trend, Spain’s yearly GDP growth rate.