Charts library
Not sure where to start? Dive into a diverse selection of charts and data visualizations across topics, and find the information you need to drive your research and analysis.
 Pro
Pro
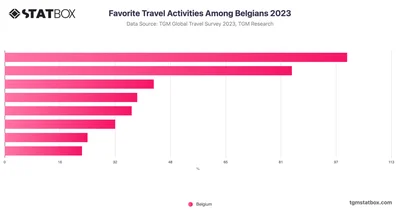
Belgian travelers prioritize cultural and gastronomic activities, with 62% engaging in such experiences. This trend aligns with other European nations like Spain and Vietnam
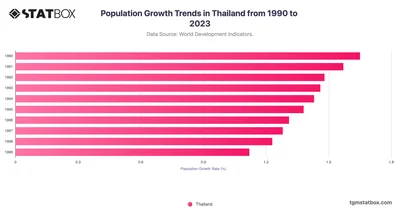
Explore Thailand’s population trends, reflecting aging and urbanization. Discover more statistics and insights in your target country on TGM StatBox.
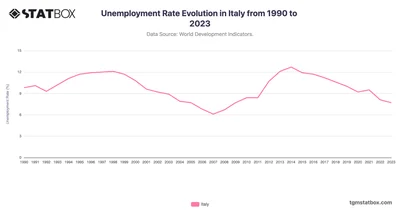
Italy’s unemployment rate fluctuated widely from the 1990s onwards, influenced by economic cycles, labor policies, and external economic pressures.
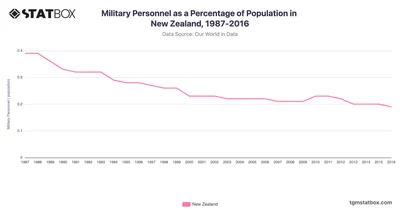
New Zealand’s military personnel as a percentage of its population declined steadily from 1987 to 2016. Discover data on New Zealand’s military personnel share on TGM StatBox.
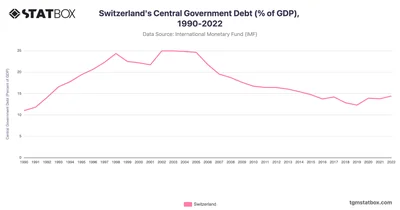
Switzerland's debt rose to 13.89% in 2020, stabilizing at 13.2% by 2022 amid fiscal efforts. Discover more statistics and insights on TGM StatBox.
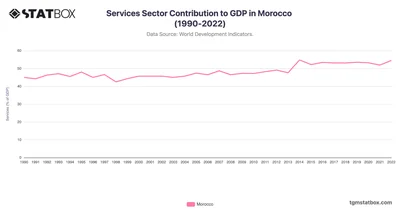
From 45% in 1990 to 54.5% in 2022, Morocco’s services sector benefitted from tourism, telecommunications, and financial services. Find more Morocco’s data on TGM StatBox.
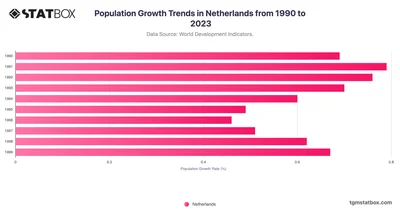
Understand the Netherlands’ population growth influenced by migration and urban expansion. Discover more statistics and insights in your target country on TGM StatBox.
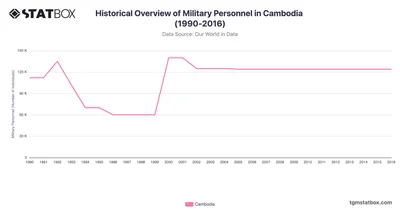
Cambodia’s military personnel levels reflected periods of conflict and stabilization. Discover more Cambodia’s statistics and insights on TGM StatBox.
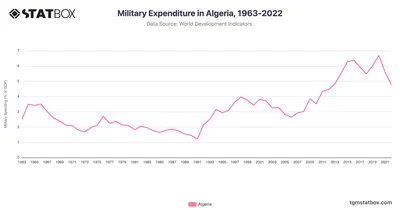
Algeria's defense spending dropped to 4.8% in 2022, reflecting security focus. Explore more statistics and insights on TGM StatBox.
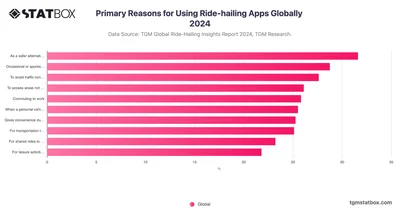
31.6% of global respondents, is using ride-hailing apps as a safer alternative when going out for events or gatherings, especially at night.
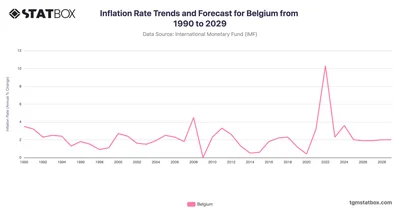
Belgium’s inflation history captures shifts tied to energy prices and global pressures. Discover more statistics and insights on TGM StatBox.
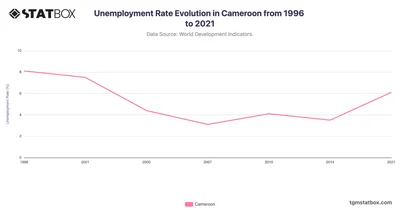
Cameroon’s unemployment rate declined significantly from 8.1% in 1996 to 3.1% in 2007. Discover the change of Cameroon’s unemployment rate over decades on TGM StatBox.
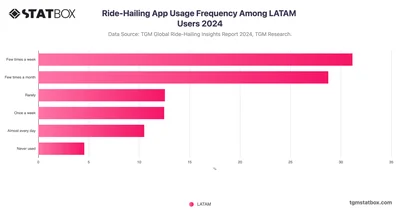
In Latin America, 54.13% of users rely on ride-hailing apps weekly, while a smaller group use them a few times a month for occasional rides.
 Pro
Pro
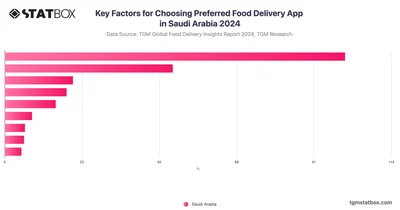
In Saudi Arabia, brand trust is the top factor in choosing food delivery apps, followed by fast order processing and a user-friendly interface for a seamless experience.
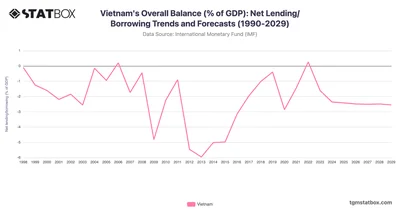
Vietnam’s fiscal performance reflects growth and resilience, with deficits stabilizing long-term. Discover more statistics and insights on TGM StatBox.
 Pro
Pro
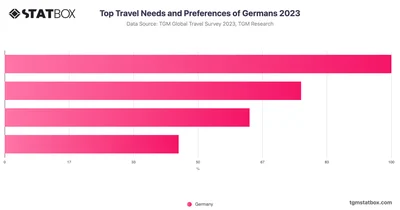
German travelers prioritize quality and comfort, with 60% emphasizing these needs, slightly above the European average, reflecting a strong preference for comfort.
 Pro
Pro
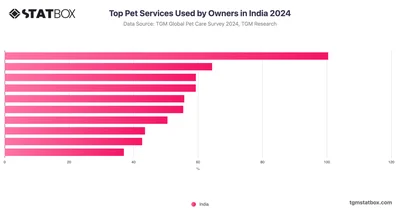
Professional grooming is the second most popular service at 29.67%, followed closely by visits to feed pets while owners are away at 29.66%.
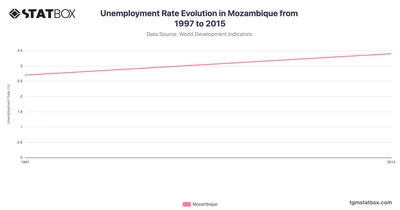
Mozambique has maintained a relatively low unemployment rate, starting at 2.7% in 1997. Discover more about Mozambique’s unemployment rate over decades on TGM StatBox.
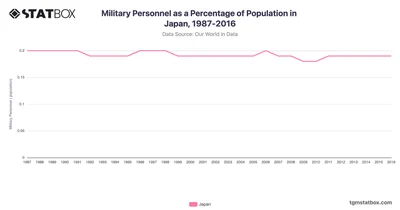
Japan’s military personnel percentage remained stable at 0.2% from 1987 to 2016. Discover data on Japan’s military personnel share on TGM StatBox.
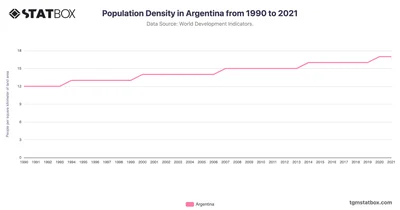
Argentina's population density rose gradually from 12 people per square kilometer in 1990 to 17 by 2021. See the full Argentina's population density data on TGM StatBox.
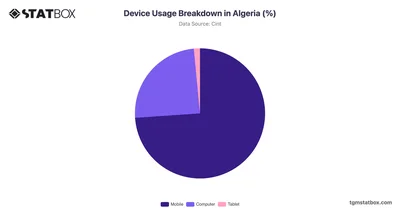
Algeria shows a strong inclination towards mobile devices, with a usage rate of 73.93%. Discover more about device usage breakdown in Algeria, on TGM StatBox.
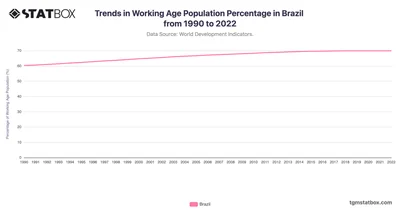
Brazil experienced a consistent rise in its working-age population, starting at 60.3% in 1990 and peaking at 69.9% by 2019. Discover complete data on TGM StatBox.
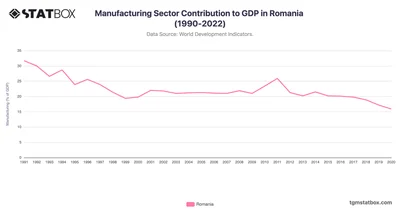
The decrease of Manufacturing Sector Contribution to GDP in Romania underscores its need to balance industrial growth with modernization challenges as part of the EU economic structure.
 Pro
Pro
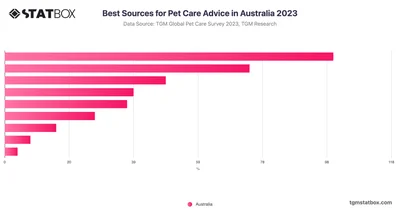
In Australia, 51.38% rely on veterinarians for pet care advice, highlighting their trust in these experts' specialized knowledge and direct interaction.
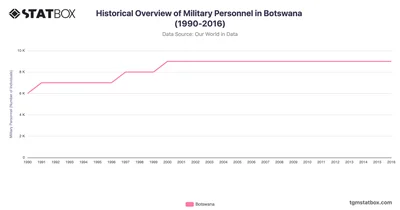
Botswana's military personnel levels exhibited steady growth during the 1990s and early 2000s. Discover more Botswana's statistics and insights on TGM StatBox.
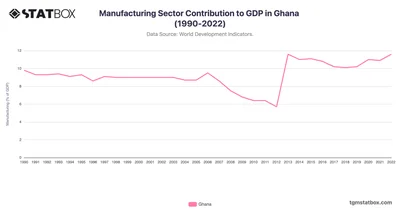
Ghana’s manufacturing sector saw moderate contribution stability, with a slight decline from 9.8% in 1990 to 6.4% by 2010. See more Ghana’s data on TGM StatBox.
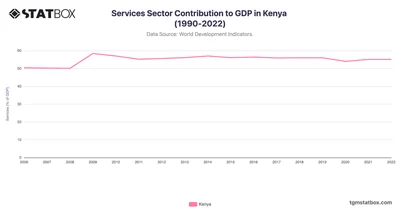
In Kenya, the services sector’s share grew from 50.4% in 2006, peaking at 58.4% in 2009. Find more Services Contribution to GDP data over the decades on TGM StatBox.
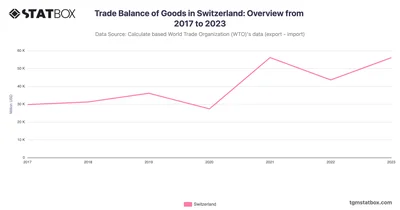
Switzerland’s trade surplus remained strong in 2023, driven by high-value pharmaceutical and precision exports. Discover more statistics and insights on TGM StatBox.
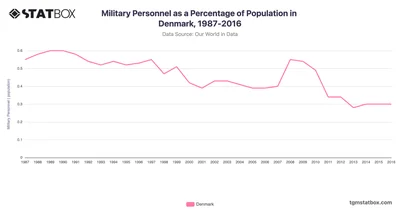
Denmark’s military personnel as a percentage of the population remained relatively stable. Discover data on Denmark’s military personnel share on TGM StatBox.
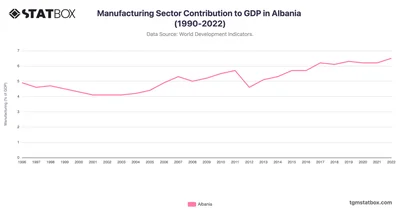
Albania’s manufacturing sector experienced gradual growth in its contribution to GDP from 4.9% in 1996 to a peak of 6.5% in 2022. See more data on TGM StatBox.






