Insights library
Explore a wide range of consumer insights and statistics across industries. Discover charts on behaviors, preferences, attitudes, and market trends to find the data most relevant to your research and decision-making.
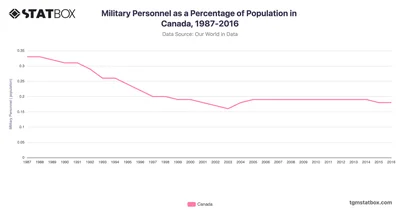
Canada’s military personnel percentage remained steady 1987 through 1994 before stabilizing from 1995 onwards. Discover Canada’s data on TGM StatBox.
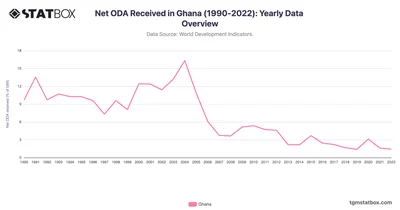
Ghana’s Net ODA peaked at 16.3% in 2004, declining to 1.4% in 2022 as oil revenues grew. Discover more statistics on TGM StatBox.
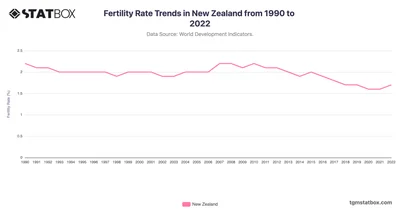
Explore New Zealand's fertility rates from 1990 to 2022, reflecting stable growth in a dynamic economy. Discover more statistics and insights on TGM StatBox.
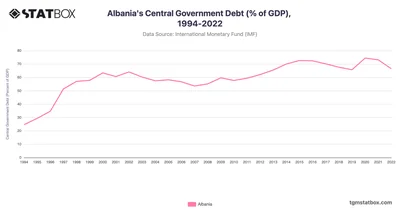
Albania's debt rose from 24.63% in 1994 to 74.45% in 2020, easing to 66.46% by 2022. Explore more fiscal trends, statistics and insights on TGM StatBox.
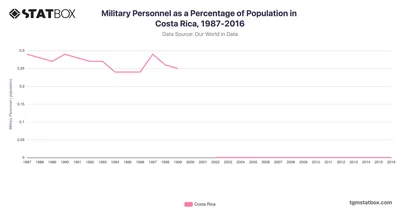
Costa Rica’s military personnel percentage decreased from 0.3% in the late 1980s to zero from 2002 onward. Discover data on Costa Rica’s military personnel share on TGM StatBox.
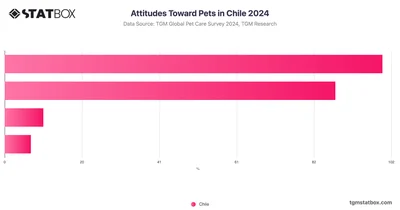 Pro
Approximately 49% of respondents expressed a fondness for "all pets". In contrast, 43% of participants indicated a preference for "specific pets".
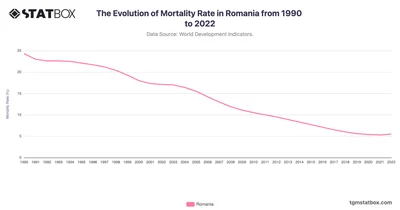
Romania’s mortality rate dropped from 24.3 in 1990 to 5.5 in 2022, showcasing healthcare advancements post-communism. Discover more insights on TGM StatBox.
 Pro
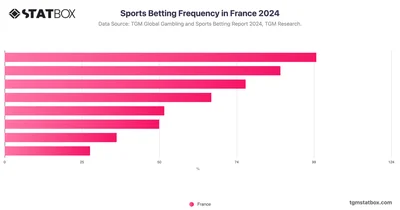
A notable trend in France is the high frequency of sports betting, with 20.15% of respondents betting a few times a week and 17.83% betting once a week.
 Pro
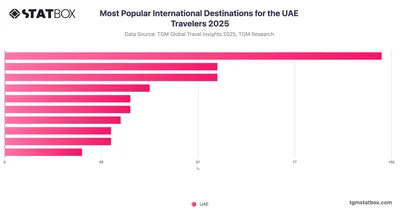
Middle East tops UAE travel in 2025, while Southeast and East Asia grow steadily, driven by visa ease and influencer-led appeal.
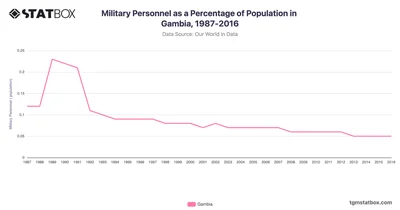
In Gambia, the percentage of military personnel relative to the population remained consistently low over the observed period. Check full data of Gambia on TGM StatBox.
 Pro
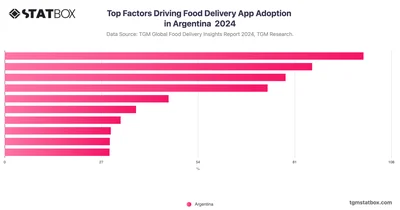
The top motivation Argetinian using food delivery apps is to avoid cooking (37.1%), followed by saving time on meal prep and taking advantage of promotions and discounts.
 Pro
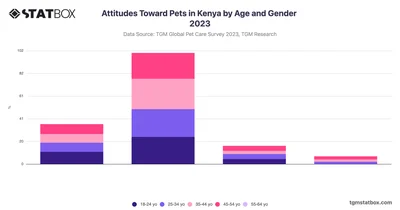
Around 60-67% of respondents across all age groups between 18-54 years old prefer specific pets rather than all animals, while roughly 20-27% express affection for all pets.
 Pro
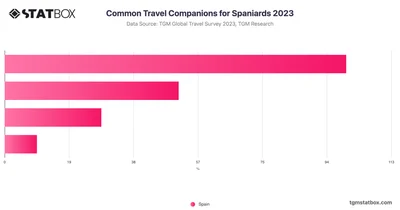
In Spain, the most common travel companions are family members, with 53% of Spaniards indicating they prefer to travel with their families.
 Pro
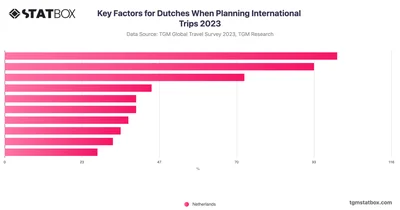
Netherlanders prioritize relaxation in travel, with 43% emphasizing free time to unwind when planning their international trips.
 Pro
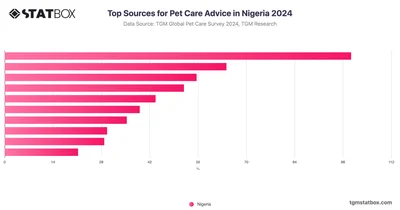
Veterinarians stand out as the most trusted source, with a significant score of 71.68% among respondents. Internet searches are also popular, with a score of 45.89%.
 Pro
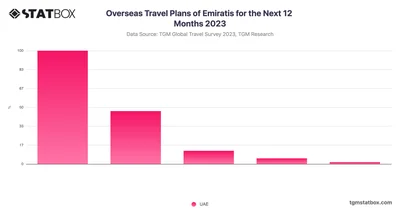
60.4% of Emiratis are very likely to travel overseas for leisure within the next 12 months. This figure positions the UAE among the highest in the world for travel intentions.
 Pro
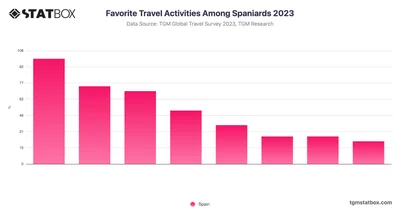
Cultural and gastronomic activities rank at the top, with 65% of Spaniards indicating a strong interest in immersing themselves in local cuisine and traditions.
 Pro
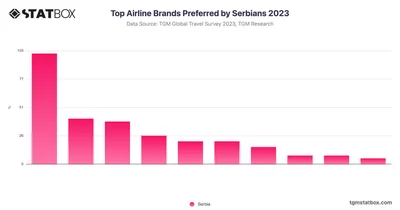
Air Serbia dominates the Serbian airline market with a 39.4% preference, likely due to its extensive network and cultural familiarity.
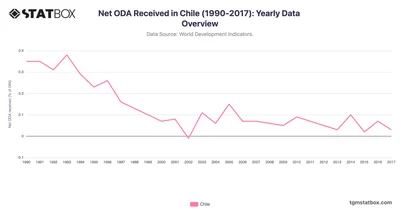
Chile’s Net ODA dropped below 0.1% by the early 2000s, reflecting its high-income status and leadership in regional development. Discover more statistics and insights on TGM StatBox.
 Pro
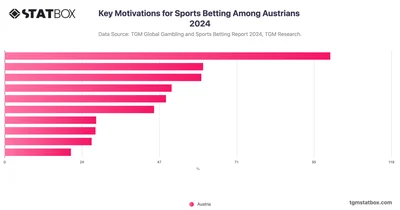
In Austria, the most common motivations for sports betting include the desire to win money (42.1%), followed by enjoying the excitement and experience.
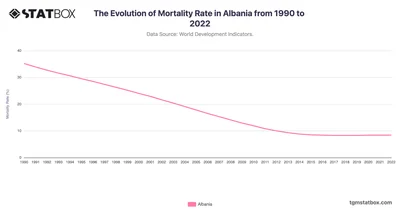
Albania’s mortality rate steadily declined from 35.2 in 1990 to 8.4 in 2022, driven by healthcare advancements. Discover more statistics and insights on TGM StatBox.
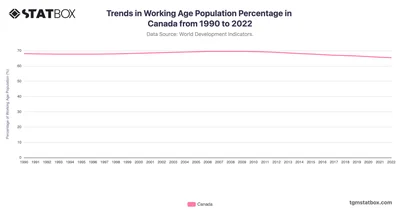
Canada’s working-age population percentage peaked at 69.5% in 2009, following steady growth since 1990. Discover the complete data on Canada’s population on TGM StatBox.
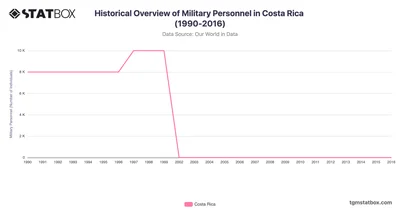
Costa Rica's military personnel trends reflect its commitment to neutrality and peaceful governance. Discover more statistics and insights on TGM StatBox.
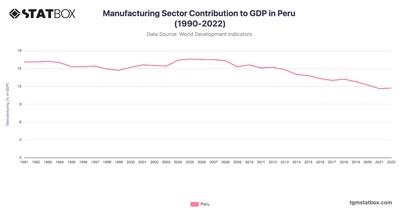
Peru’s manufacturing sector maintained a steady GDP contribution of around 16% in the early 2000s. See more Peru’s GDP data on TGM StatBox.
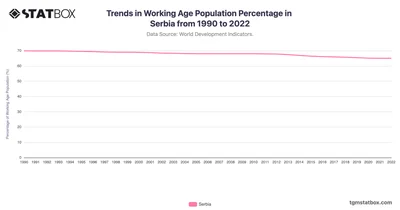
Serbia’s working-age population has seen a gradual but steady decline since 1990, dropping from 69.9% to 65% by 2022. Discover the complete data on TGM StatBox.
 Pro
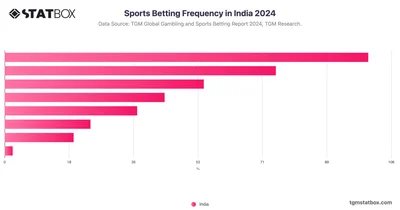
The most common frequency is betting 'a few times a week,' reported by 28.2% of Indian respondents, followed by 21% who bet a few times a month.
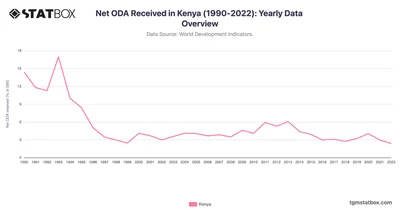
Kenya’s Net ODA peaked at 17% in 1993, declining to 2.4% by 2022 as governance improved. Discover more insights on TGM StatBox.
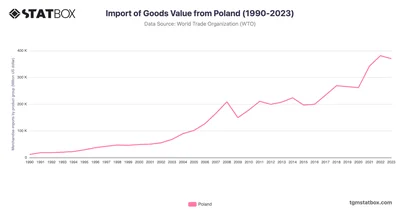
Poland’s imports soared from $11.5B in 1990 to $381.1B in 2022, driven by industrial growth and EU integration. Discover more statistics and insights on TGM StatBox.
 Pro
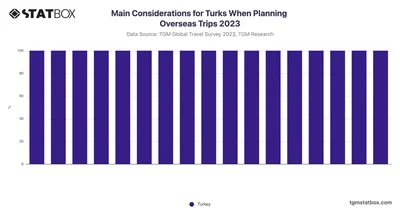
Cost and affordability rank as the most important factor for Turkish travelers when planning international trips, with 30% citing it as a key consideration.
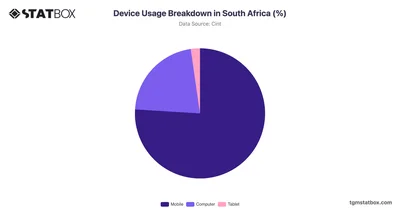
South Africa exhibits a strong preference for mobile devices, with 75.97% of users relying on them. Discover more about device usage breakdown on TGM StatBox.