Insights library
Explore a wide range of consumer insights and statistics across industries. Discover charts on behaviors, preferences, attitudes, and market trends to find the data most relevant to your research and decision-making.
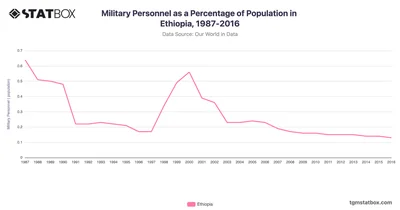
Ethiopia's military personnel as a percentage of the population showed notable shifts between 1987 and 2016. Check full data of Ethiopia on TGM StatBox.
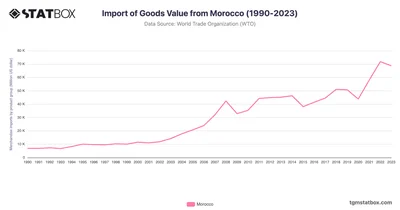
Morocco’s imports rose from $6.9B in 1990 to $71.8B in 2022, driven by industrial and consumer growth. Discover more statistics and insights on TGM StatBox.
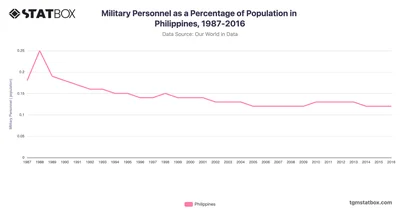
The Philippines displayed a steady decline in military personnel as a percentage of its population to a low of 0.1% by 1995. Discover more on TGM StatBox.
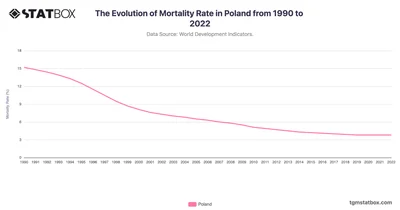
Poland’s mortality rate decreased from 15.2 in 1990 to 3.8 in 2022, driven by healthcare reforms and economic transition. Discover more insights on TGM StatBox.
 Pro
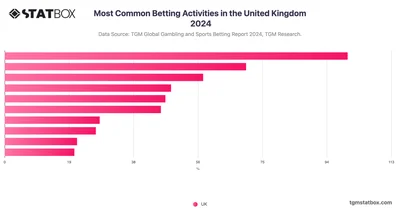
Explore the most common betting activities in the United Kingdom, including popular sports and casino games, through this detailed TGM Statbox chart.
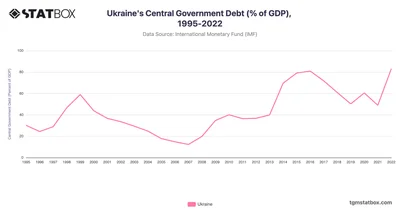
Ukraine’s debt peaked at 83.12% in 2022, driven by war-related borrowing. Explore more fiscal data, statistics and insights on TGM StatBox.
 Pro
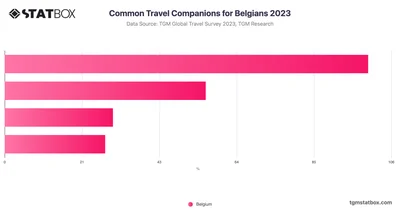
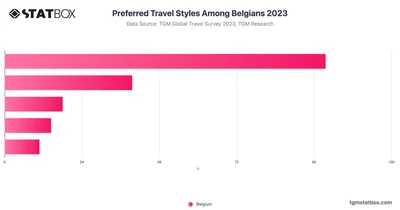
In Belgium, family is the top choice for travel companionship, with 47% of respondents favoring this option. In addition, solo travel is becoming increasingly popular in Belgium.
 Pro
Relaxation and discovery trips are the top choice for 82.86% of Belgians. Countries like Germany and Italy also show a strong inclination towards stress-free travel
 Pro
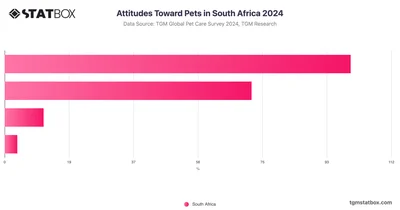
South African respondents have a selective approach to pet ownership, with 53.7% expressing a preference for specific types of pets.
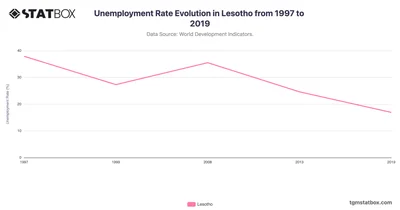
Lesotho has struggled with high unemployment rates, marked by a peak of 37.9% in 1997. Discover more about Lesotho’s unemployment rate over decades on TGM StatBox.
 Pro
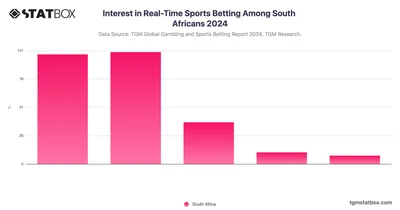
Analyze the growing interest in real-time sports betting among South Africans, highlighting trends and preferences with this TGM Statbox chart.
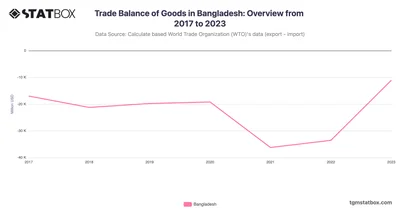
Bangladesh’s trade deficit shrank in 2023, supported by resilient textile exports despite high import dependency. Discover more statistics and insights on TGM StatBox.
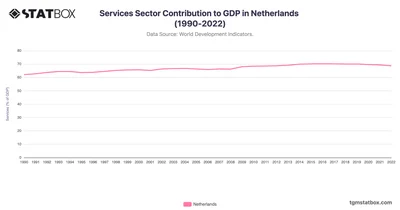
The services sector in the Netherlands consistently expanded its GDP share from 62.1% in 1990 to 70.1% in 2015. Find more Netherlands' data on TGM StatBox.
 Pro
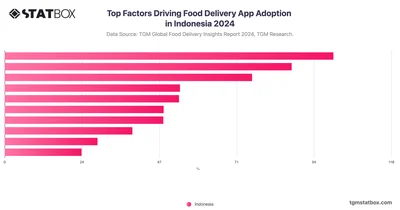
In Indonesia, food delivery use is driven by deals (42.5%), time-saving, and convenience. Safety and health also matter, but value is the top priority for most users.
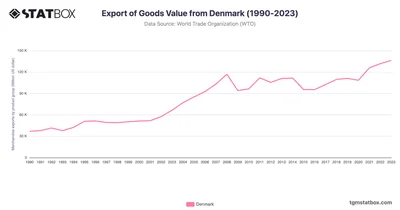
Discover Denmark's export trends from 1990 to 2023, emphasizing pharmaceuticals and agriculture. Discover more statistics and insights on TGM StatBox.
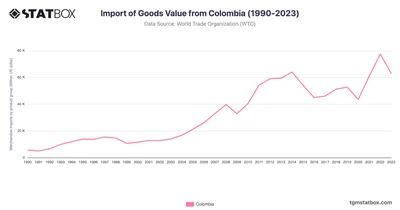
Colombia’s imports rose from $5.5B in 1990 to $77.4B in 2022, driven by industrialization and trade expansion. Discover more statistics and insights on TGM StatBox.
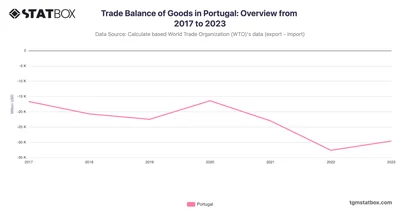
Portugal’s trade deficit remained high in 2023, reflecting reliance on energy and consumer goods imports. Discover more statistics and insights on TGM StatBox.
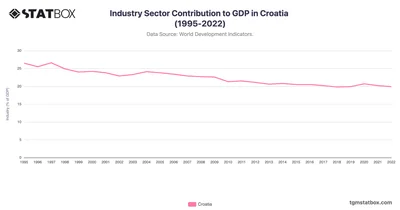
Since 1995, Croatia’s industry sector contribution has trended downward, from 26.5% to a stable range around 20% in recent years. Find more data on TGM StatBox.
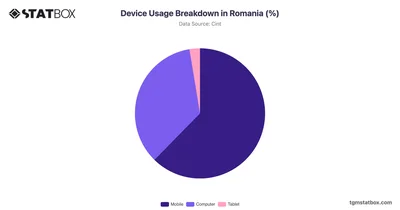
Explore device usage breakdown in Romania, showcasing percentage distribution of smartphones, tablets, desktops. Analyze the trends shaping digital habits.
 Pro
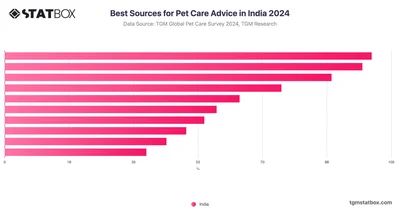
While veterinarians remain a trusted source of advice (44,72%), Indian pet owners show a particularly strong inclination towards social media and internet searches.
 Pro
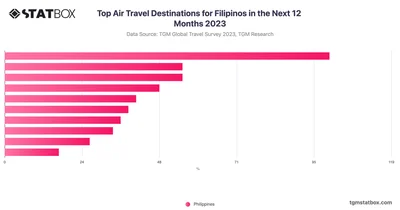
Southeast Asia is the top choice for 42% of Filipinos planning to travel next year, thanks to its proximity and cultural similarities that offer affordable options.
 Pro
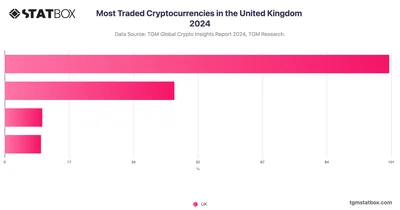
Bitcoin is the UK’s most traded crypto, followed by Ethereum. Sweatcoin and Dogecoin cater to niche interests in fitness and community-driven investments.
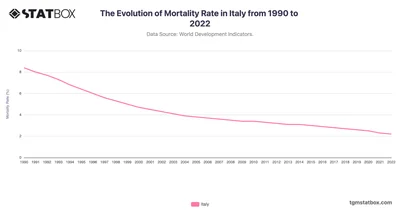
Italy’s mortality rate fell from 8.4 in 1990 to 2.2 in 2022, reflecting sustained public health progress. Discover more statistics and insights on TGM StatBox.
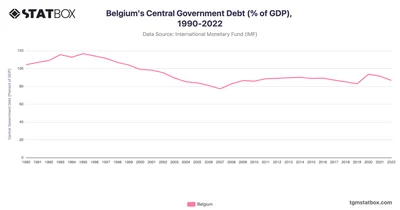
Belgium's debt dropped from 116.61% in 1995 to 86.62% by 2022, reflecting fiscal reforms. Discover detailed statistics and insights on TGM StatBox.
 Pro
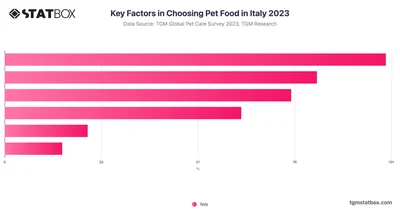
Quality leads Italian pet food preferences at 78.87% of consumer priority, followed by ingredient composition and price considerations.
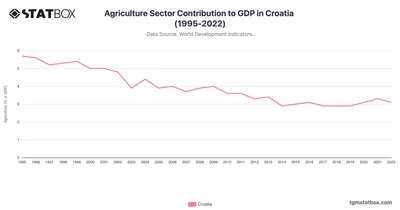
Croatia's agriculture sector’s contribution to GDP gradually decreased to around 3.1% by 2022. Discover the full Croatia's agriculture GDP data at TGM StatBox.
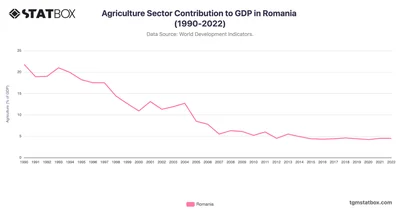
Discover Romania’s agriculture GDP journey from post-communist restructuring to EU integration. Find the full Romania’s agriculture GDP data at TGM StatBox.
 Pro
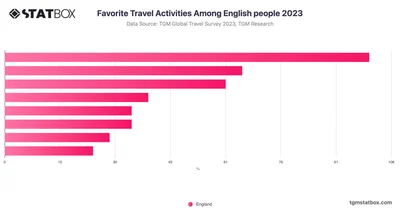
When it comes to travel activities, English citizens show a clear preference for beach and leisure activities, which rank the highest at 66%.
 Pro
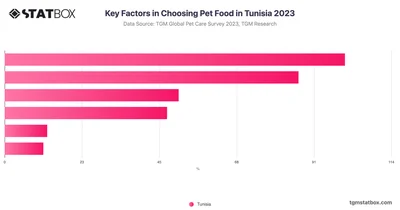
The most significant determinant when choosing pet food is quality, with an impressive 88% of respondents indicating it as their top choice.
 Pro
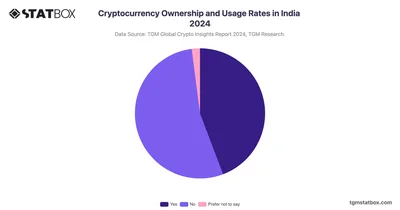
With 44% of respondents having owned or used cryptocurrency, there is a solid base of active users, indicating growing interest in digital currencies.