Insights library
Explore a wide range of consumer insights and statistics across industries. Discover charts on behaviors, preferences, attitudes, and market trends to find the data most relevant to your research and decision-making.
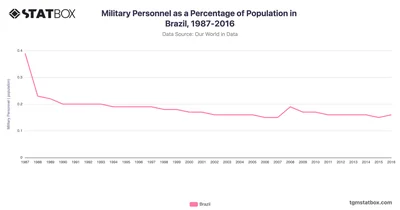
Brazil’s military personnel percentage declined to 0.2% by 1988, maintaining this level through 2016. Discover data on Brazil’s military personnel share on TGM StatBox.
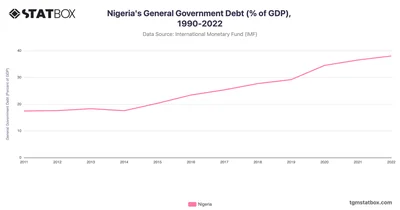
Nigeria's General Government Debt (% of GDP) exhibited a steady increase from 2011 to 2022. Discover more Nigeria's statistics on TGM StatBox.
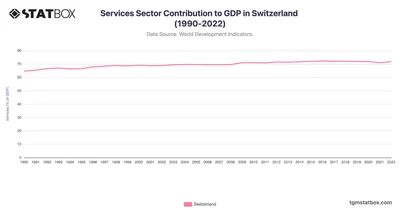
Switzerland’s services sector consistently expanded its share of GDP, starting from 64.7% in 1990 and gradually increasing over the next three decades.
 Pro
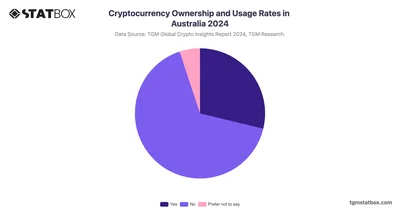
66% of Australians have never owned or used cryptocurrency, highlighting key adoption barriers like security concerns, trust issues, and regulatory uncertainty.
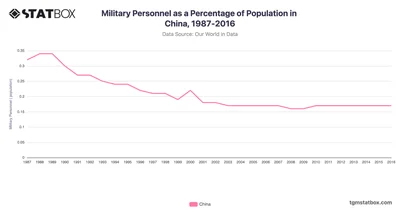
Military personnel as a percentage of the population in China 1987-2016 shows a consistent trend of stability in military size relative to its vast population. Get full data on TGM StatBox.
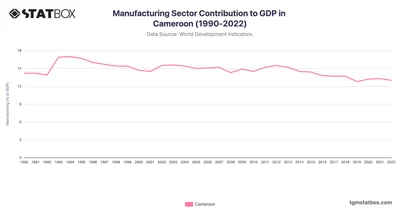
Cameroon’s manufacturing sector contributed steadily to GDP over the past three decades, with a peak at 17.0% in 1994. See more Cameroon’s data on TGM StatBox.
 Pro
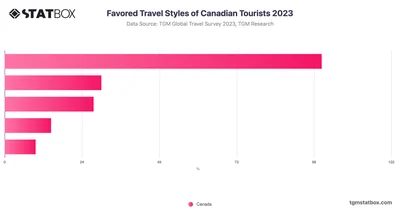
Canadian travelers mostly prefer relaxation and discovery trips, which offers cultural exploration and leisure activities, highlighting a desire for stress-free experiences.
 Pro
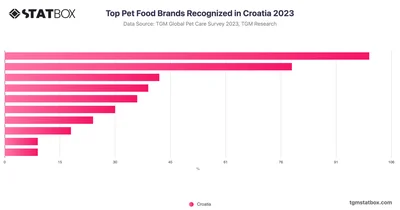
Whiskas emerged as the leading pet food brand in Croatia, capturing 33% of the market share. The brand has strong appeal among pet owners in the region.
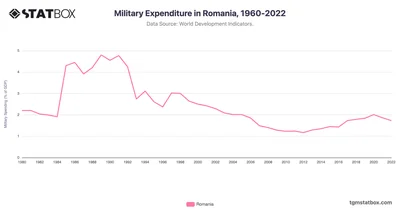
Romania's defense spending fell to 1.7% in 2022 amid fiscal constraints. Learn more statistics and insights on TGM StatBox.
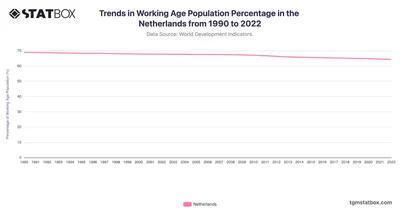
The working-age population in the Netherlands declined gradually to 64.3% in 2022. Discover the complete data on Netherlands's working-age population on TGM StatBox.
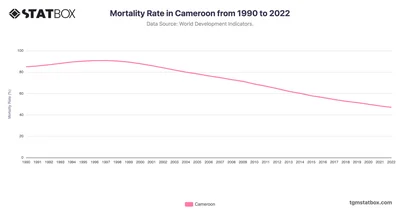
Cameroon’s mortality rate fell from 84.9 in 1990 to 47.0 in 2022, driven by public health initiatives combating infectious diseases. Discover more statistics on TGM StatBox.
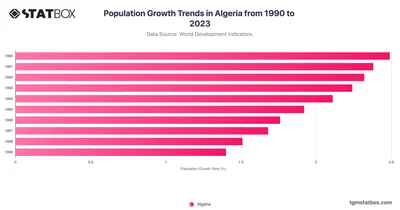
Since 2018, Algeria's Population Growth rate declined steadily, reaching 1.6% in 2023, influenced by slowing birth rates, evolving family structures, and increasingly urban population.
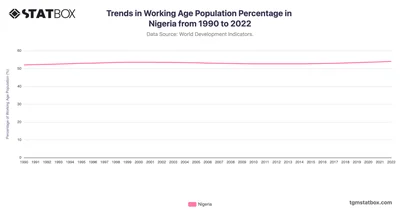
After a brief period of stability and minor declines from 2000 to 2010, Nigeria's working-age population started to rise again. Discover the complete data on TGM StatBox.
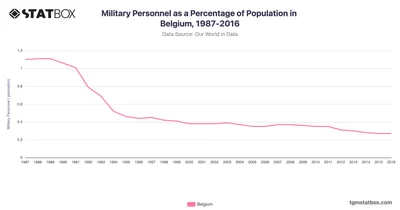
Belgium’s military personnel percentage declined sharply from 1.1% in 1987 to 0.3% in 2016. Discover data on Belgium’s military personnel share on TGM StatBox.
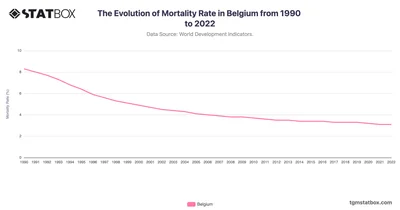
Belgium’s mortality rate dropped from 8.3 in 1990 to 3.1 in 2022, reflecting healthcare improvements. Discover more statistics and insights on TGM StatBox.
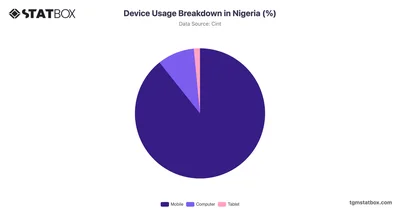
Nigeria displays a remarkable inclination towards mobile devices, with 89.30% of users opting for them. Discover more about device usage breakdown in Nigeria, on TGM StatBox.
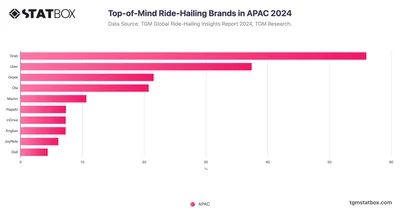
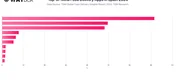
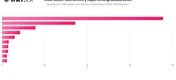
When thinking of ride-hailing applications operating in the APAC region, the top brands that come to mind are Grab, Uber, and Gojek.
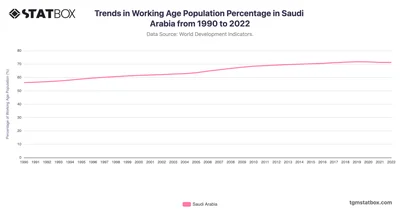
Saudi Arabia experienced a consistent increase in its working-age population from 56.1% in 1990 to 71.7% in 2019. Discover the complete data on TGM StatBox.
 Pro
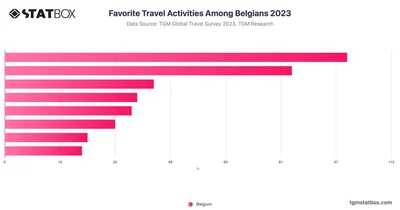
Belgian travelers prioritize cultural and gastronomic activities, with 62% engaging in such experiences. This trend aligns with other European nations like Spain and Vietnam
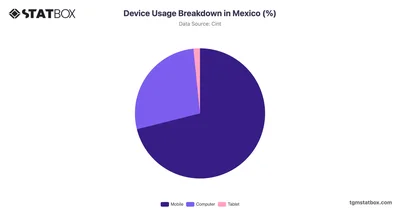
Gain insights into device usage landscape in Mexico, highlighting percentage share of smartphones, tablets, desktops. Discover more digital preferences at TGM StatBox.
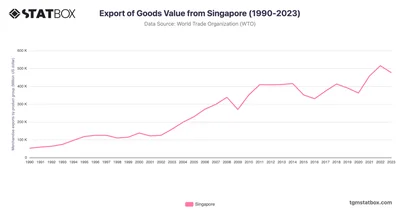
See Singapore's export journey from 1990 to 2023, emphasizing technology and re-export trade. Discover more statistics and insights on TGM StatBox.
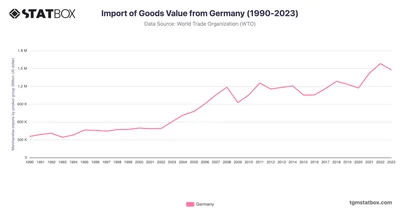
Germany’s imports increased from $355.6B in 1990 to $1.58T in 2022, showcasing its industrial and export-driven economy. Discover more statistics and insights on TGM StatBox.
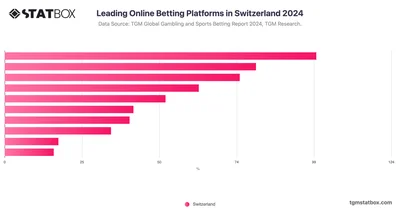 Pro
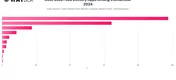
Identify the leading online betting platforms in Switzerland, offering insights into the most popular platforms and their market share with this TGM Statbox chart.
 Pro
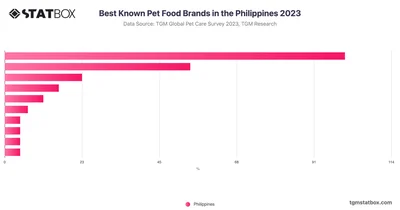
Pedigree leads the pet food market in the Philippines, with 44% of respondents choosing it as their preferred brand. Whiskas and Royal Canin are also popular choices.
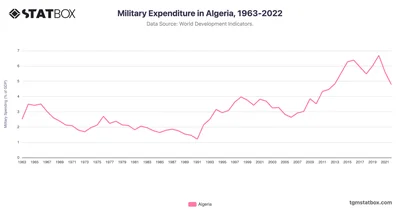
Algeria's defense spending dropped to 4.8% in 2022, reflecting security focus. Explore more statistics and insights on TGM StatBox.
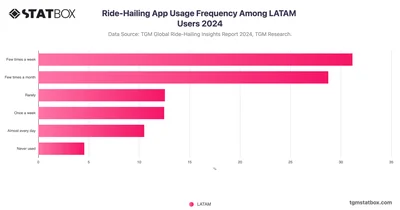
In Latin America, 54.13% of users rely on ride-hailing apps weekly, while a smaller group use them a few times a month for occasional rides.
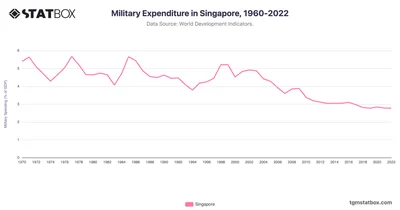
Singapore's defense spending stabilized at 2.8% by 2022, emphasizing readiness. Find more statistics and insights on TGM StatBox.
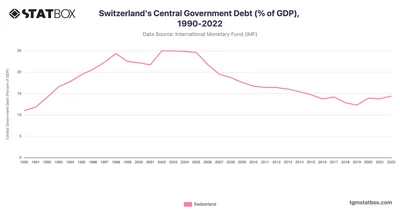
Switzerland's debt rose to 13.89% in 2020, stabilizing at 13.2% by 2022 amid fiscal efforts. Discover more statistics and insights on TGM StatBox.
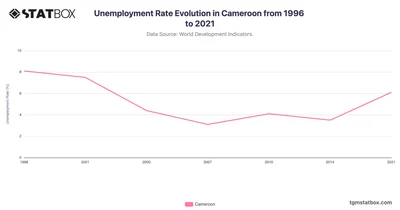
Cameroon’s unemployment rate declined significantly from 8.1% in 1996 to 3.1% in 2007. Discover the change of Cameroon’s unemployment rate over decades on TGM StatBox.
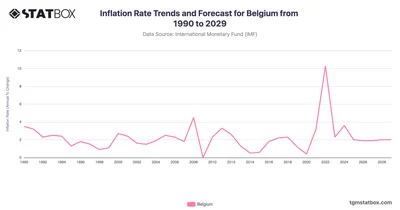
Belgium’s inflation history captures shifts tied to energy prices and global pressures. Discover more statistics and insights on TGM StatBox.