Romania's military expenditure surged in the late 1980s, peaking at 4.8% in 1989 under the Communist regime. This period reflected heavy state-controlled investments in defense amid the Cold War. After the fall of communism, spending sharply decreased to 2.7% in 1993, as the country transitioned to a market economy and faced economic restructuring.
In the 2000s, expenditure further declined, stabilizing around 1.2–2.0% of GDP. A significant increase to 2.0% occurred in 2020, reflecting Romania's commitment to NATO's 2% guideline amid growing regional tensions in Eastern Europe. By 2022, spending slightly declined to 1.7%, balancing modernization efforts with broader economic constraints.
In the 2000s, expenditure further declined, stabilizing around 1.2–2.0% of GDP. A significant increase to 2.0% occurred in 2020, reflecting Romania's commitment to NATO's 2% guideline amid growing regional tensions in Eastern Europe. By 2022, spending slightly declined to 1.7%, balancing modernization efforts with broader economic constraints.
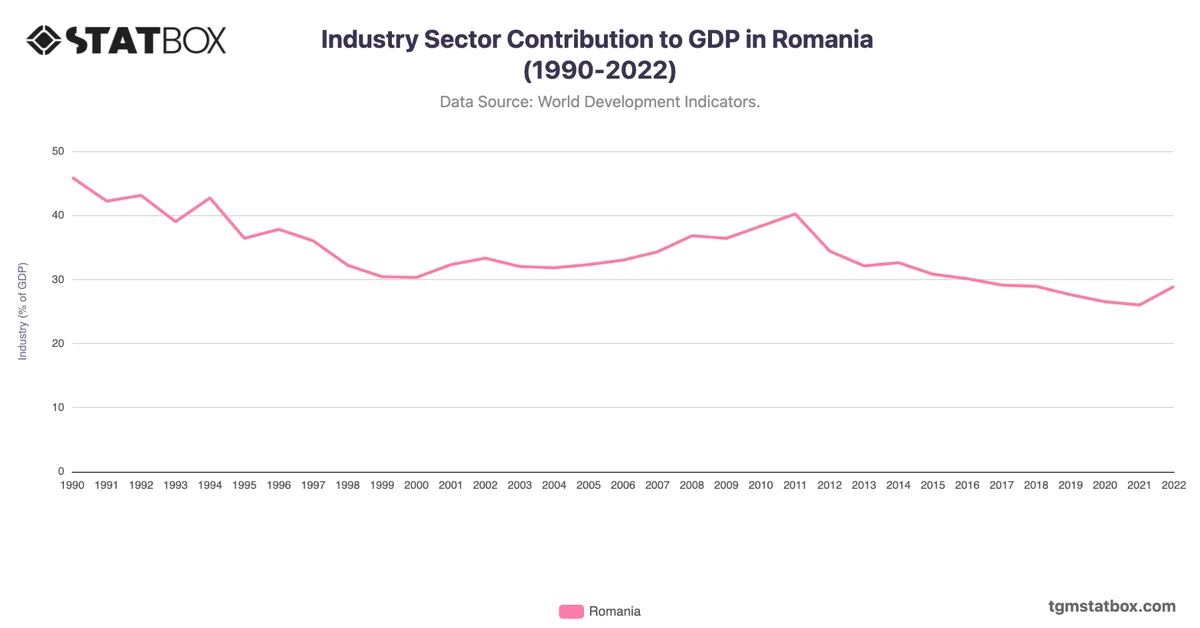
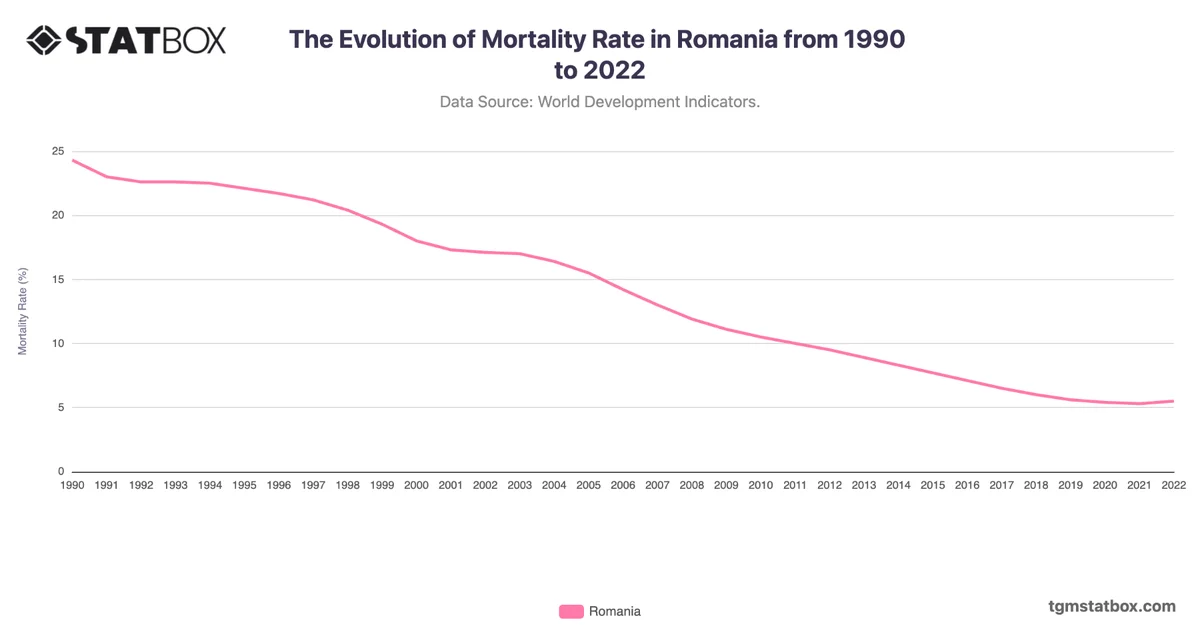
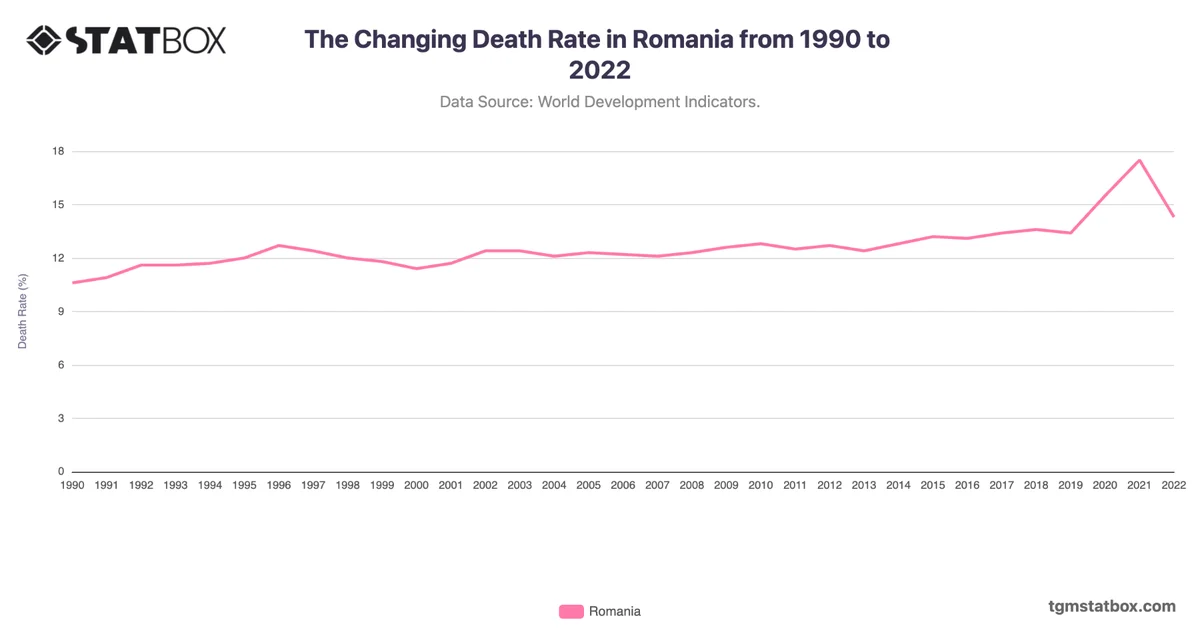
Gain a broader perspective by reviewing Romania’s population statistics, Romania’s mortality trend, Romania’s industry sector share in GDP.