Ethiopia's GDP growth rate from 1962 to 2023 tells a story of transformation from a struggling, war-torn economy to one of Africa's fastest-growing, albeit with ongoing challenges and vulnerabilities.
The 1960s through 1980s were marked by economic volatility, with unstable growth rates due to political instability, drought, and inefficient centralized economic policies under the Derg regime. The 1990s saw a transition towards stability and modest growth following market-oriented reforms. However, the real turning point came in the 2000s, with growth rates consistently exceeding 8% and peaking at 13.6% in 2004. This remarkable performance continued through the 2010s, averaging 9.5% annually, positioning Ethiopia as one of Africa's fastest-growing economies. The period from 2020 to 2023 saw some moderation due to the COVID-19 pandemic and regional conflicts, but growth remained resilient at 6%.
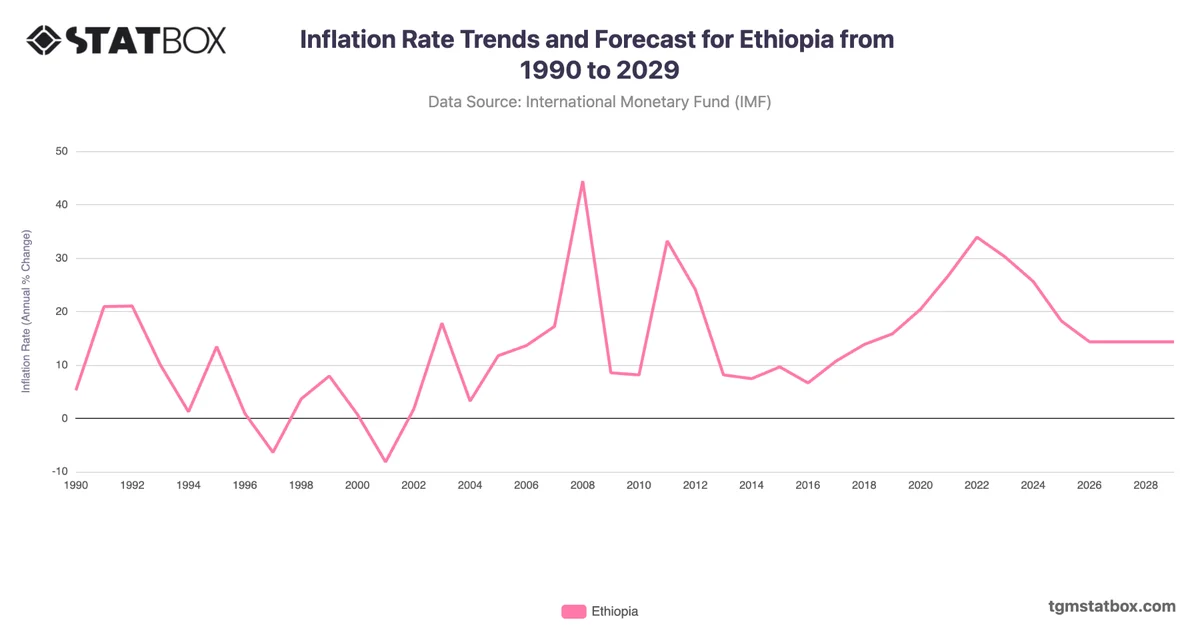
Throughout this period, Ethiopia's economic growth has been driven by agricultural improvements, industrialization efforts, service sector expansion, and significant public investments in infrastructure. However, challenges persist, including high inflation, foreign exchange shortages, and regional instability.
Gain a broader perspective by reviewing Ethiopia’s population numbers, Ethiopia’s manufacturing sector share in GDP, Ethiopia’s annual GDP figures.