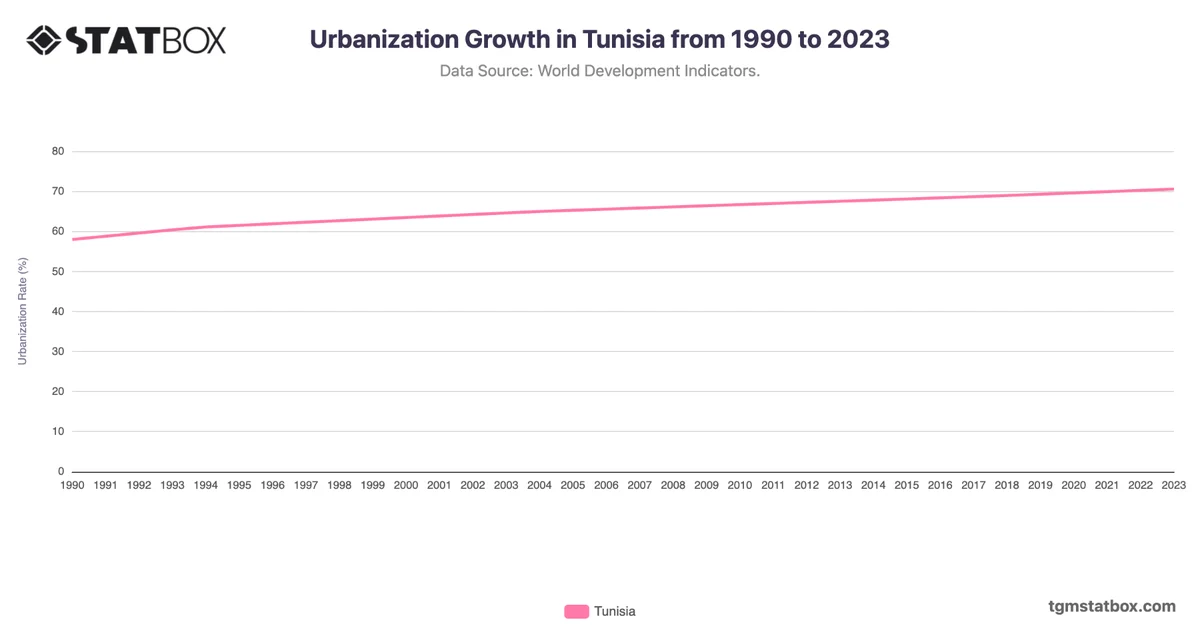
Tunisia’s population density rose from 54 people per square kilometer in 1990 to 79 by 2021, driven largely by urban migration to cities such as Tunis, Sfax, and Sousse. The country’s economic growth and improvements in public services in urban areas attracted people from rural regions, increasing density in metropolitan areas.
Despite this growth, rural areas remain relatively sparsely populated, balancing the national density. Tunisia’s development strategy has increasingly focused on urbanization and economic diversification, indicating that urban centers will continue to shape the population density trends moving forward.
Despite this growth, rural areas remain relatively sparsely populated, balancing the national density. Tunisia’s development strategy has increasingly focused on urbanization and economic diversification, indicating that urban centers will continue to shape the population density trends moving forward.
For a deeper dive into the topic, explore Tunisia’s agricultural sector share in GDP, Tunisia’s net ODA received, Tunisia’s manufacturing sector share in GDP.