Share the statistic on social media channels or embed the statistic in your website using "Embed Code", where available.
Share chart
Embed chart Embed copied!Cite this statistic and select one of the following formats: APA, Chicago, Harvard, MLA & Bluebook
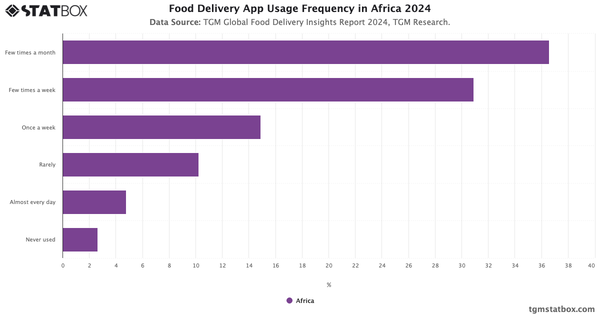
"How often do you use food delivery app?"
Key Takeaways
Food delivery app usage in the APAC region is widespread, with over 91% of respondents reporting that they have used such apps at least once. However, daily usage remains relatively low at just 8.56%, suggesting untapped potential for increasing habitual engagement. Only 1.37% have never used a food delivery app, highlighting a highly saturated market in terms of awareness and adoption. For app providers, the greatest opportunities lie in increasing order frequency among medium-frequency users and boosting retention among high-frequency customers. Strategic efforts such as loyalty programs, subscription models, and personalized incentives could help shift occasional users into more consistent, high-value segments.

Food Delivery Insights Report in APAC
Discover all you need to know about Food Delivery in APAC with TGM StatBox. Get the comprehensive report, featuring graphs and tables for insights.
Go to report


Connect with our expert team for immediate assistance or comprehensive market analysis. We are always ready to support your business needs.