Share the statistic on social media channels or embed the statistic in your website using "Embed Code", where available.
Share chart
Embed chart Embed copied!Cite this statistic and select one of the following formats: APA, Chicago, Harvard, MLA & Bluebook
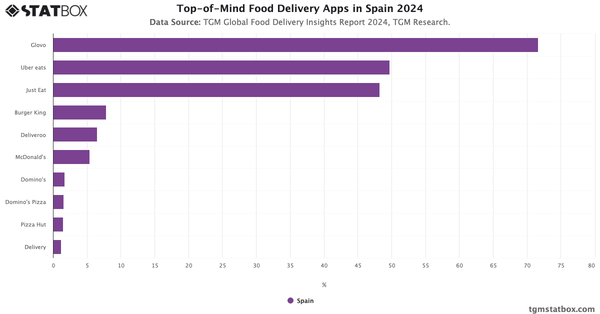
"How often do you use food delivery app?"
Key Takeaways
42% of Spanish respondents order from food delivery apps at least once a week, while 38.62% use them more occasionally, such as a few times a month. This usage pattern varies depending on individual reasons. Some people turn to food delivery apps for special events or adverse weather conditions, while others make it a habit, using the service more frequently to avoid cooking and save time on meal preparation and cleaning.

Food Delivery Insights Report in Spain
Discover all you need to know about Food Delivery in Spain with TGM StatBox. Get the comprehensive report, featuring graphs and tables for insights.
Go to report


Connect with our expert team for immediate assistance or comprehensive market analysis. We are always ready to support your business needs.