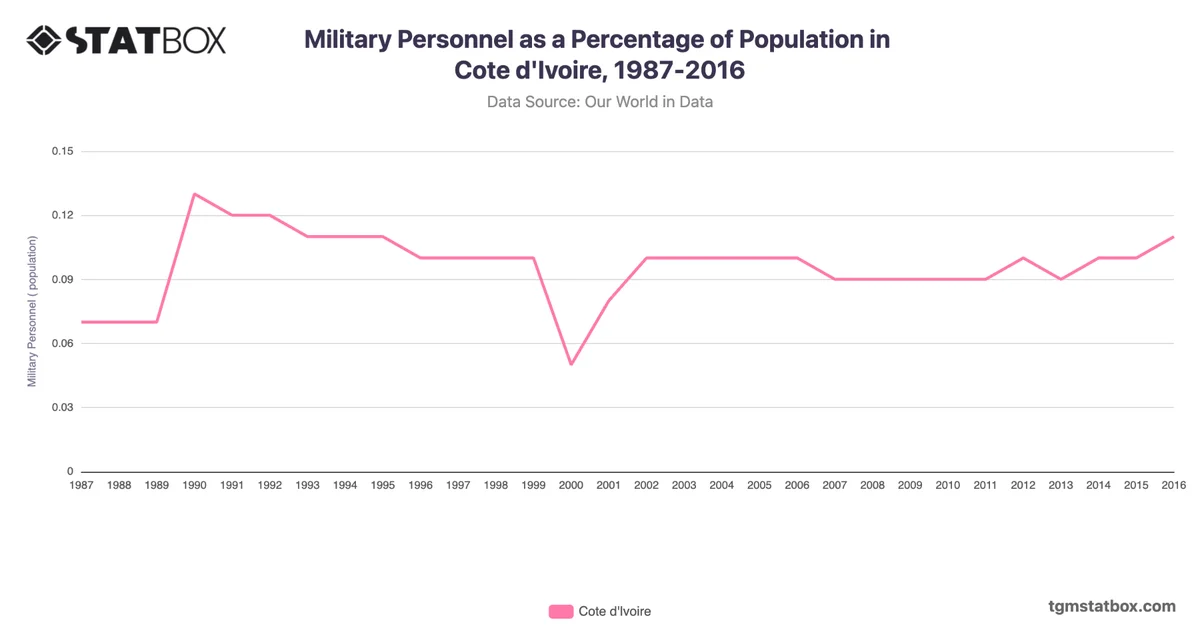
Côte d'Ivoire's military expenditure displayed modest fluctuations, shaped by its post-independence stability and later political crises. During the 1960s and 1970s, spending remained around 1% of GDP, reflecting the country’s relatively peaceful status under Félix Houphouët-Boigny. However, the 2000s saw a brief rise to 1.3% by 2009, influenced by civil unrest and efforts to restore stability.
In recent years, spending has stabilized at around 1% of GDP, reflecting a return to political calm and a focus on rebuilding. The slight decline to 0.9% in 2022 underscores efforts to optimize defense budgets amid broader economic challenges and regional security cooperation.
In recent years, spending has stabilized at around 1% of GDP, reflecting a return to political calm and a focus on rebuilding. The slight decline to 0.9% in 2022 underscores efforts to optimize defense budgets amid broader economic challenges and regional security cooperation.
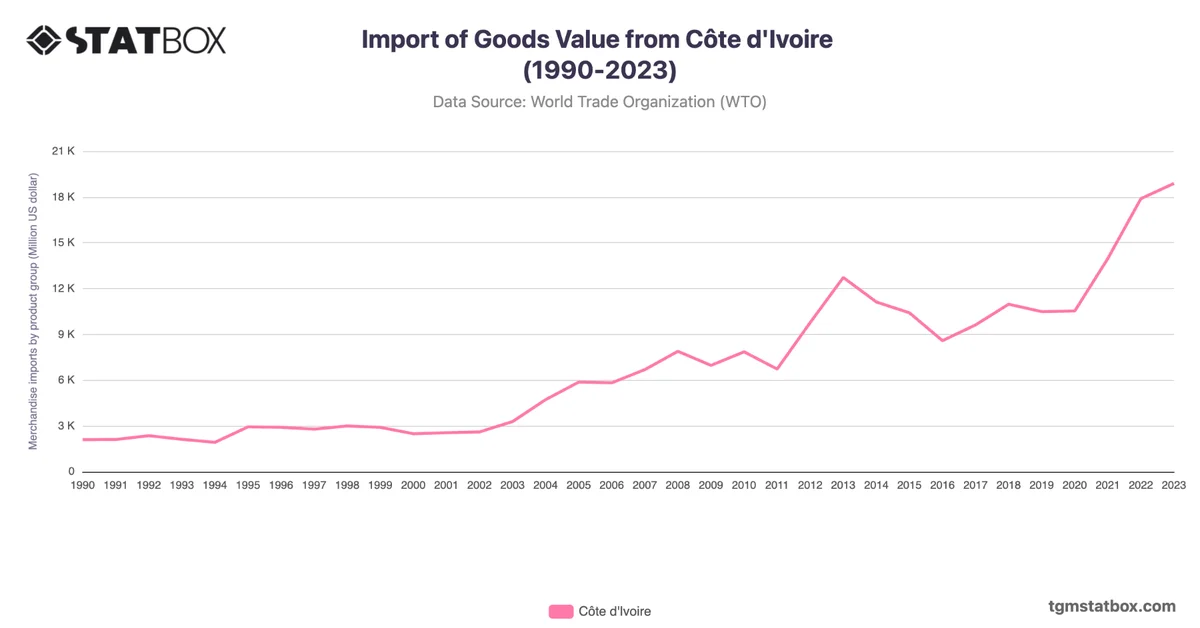
Find out more through related statistics on Côte d’Ivoire’s yearly net ODA, Côte d’Ivoire’s population numbers, Côte d'Ivoire’s goods import value.