Gender-Based Divergence in Christmas Purchase Decision Criteria
Christmas shopping represents one of the highest-stakes consumer spending periods of the year, with households navigating decisions across multiple product categories, retailers, and channels simultaneously. Price sensitivity, brand perception, and convenience all compete as influencing factors, and their relative weight tends to vary meaningfully across demographic groups.
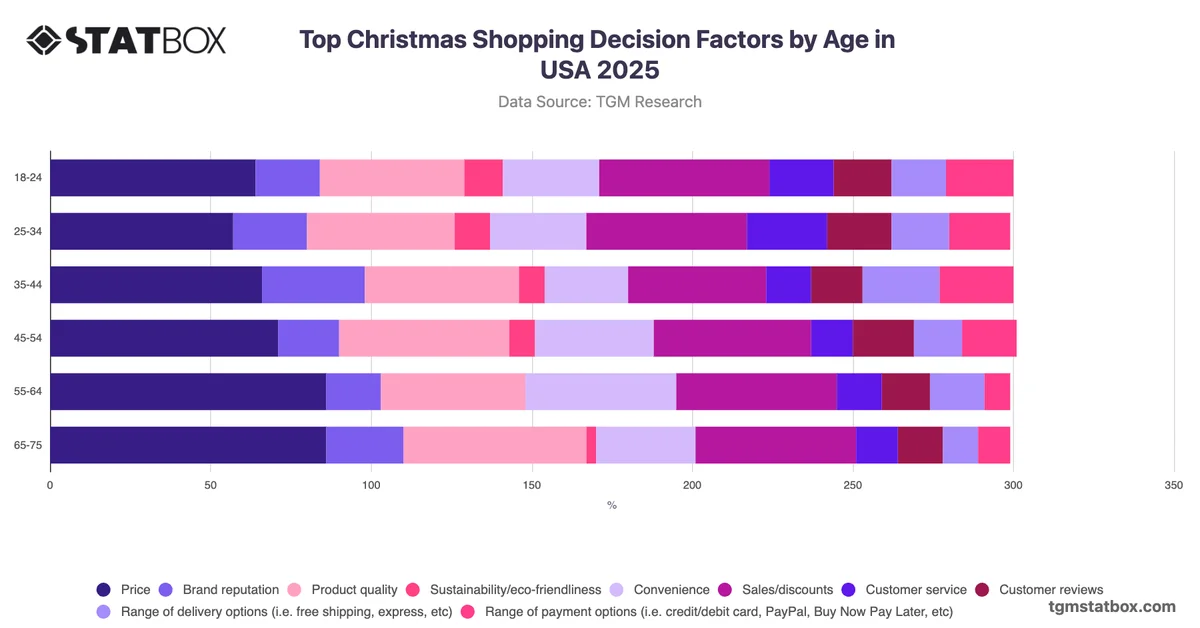
The most analytically significant pattern in US Christmas shopping decision-making is not where men and women agree, but where they diverge most sharply. Price is the dominant factor for both genders, cited by 75% of women and 66% of men, confirming its near-universal primacy. However, brand reputation produces the largest gender gap in the data: 29% of men prioritise it compared to only 17% of women, a 12-percentage-point difference that suggests male shoppers place considerably greater weight on brand equity as a proxy for quality or status. Women, by contrast, index more strongly on sales and discounts at 54% versus 44% among men, indicating a greater orientation toward transactional value. These contrasting patterns suggest that Christmas retail communications targeting men may benefit from brand credibility messaging, while promotions and discount visibility may carry stronger conversion potential among female audiences.