Chart

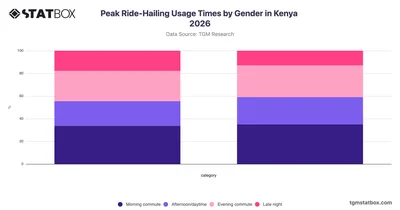
Peak Ride-Hailing Usage Times by Gender in Kenya 2026

Log in to unlock

No account? Sign up free — new members get 3 premium charts to view.

Insights

Key Takeaways

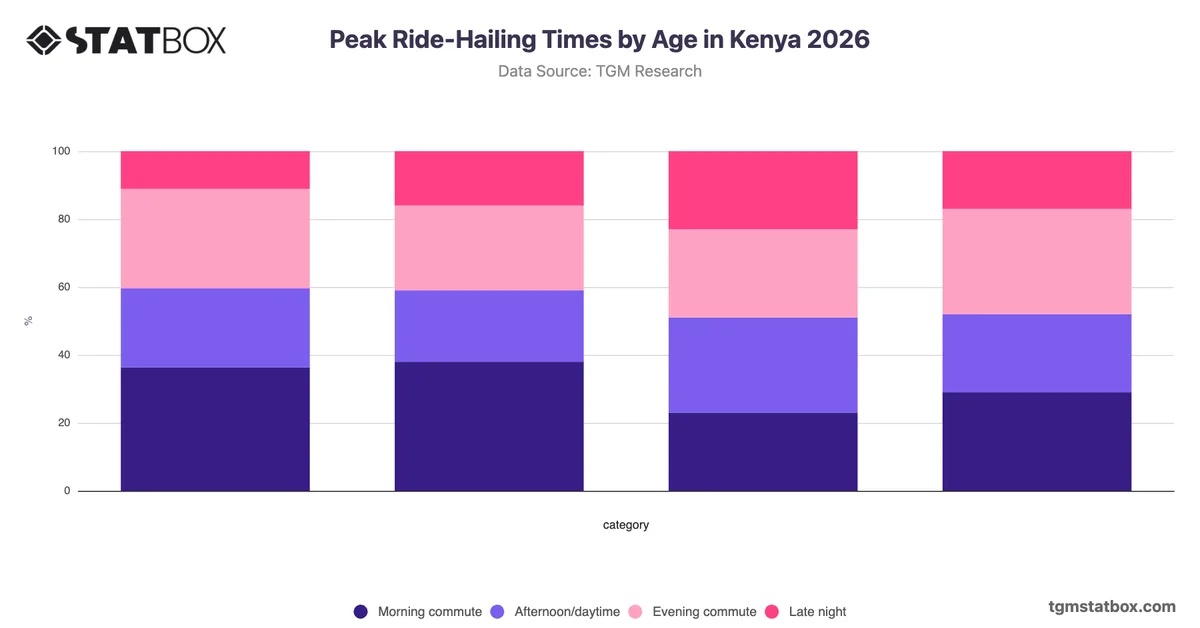
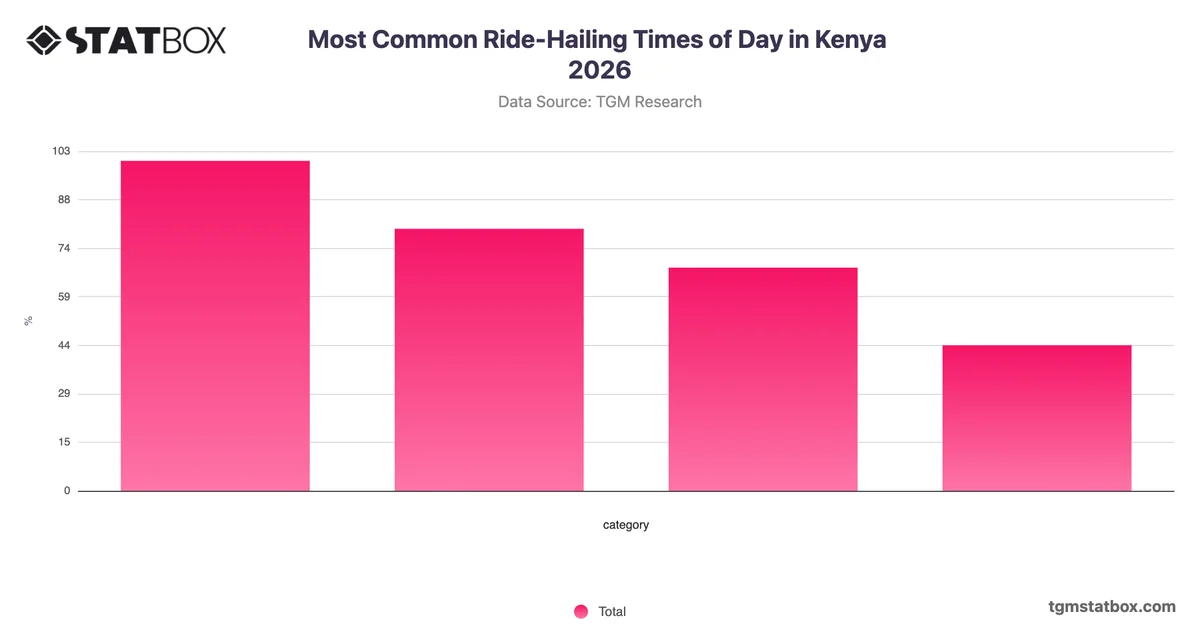
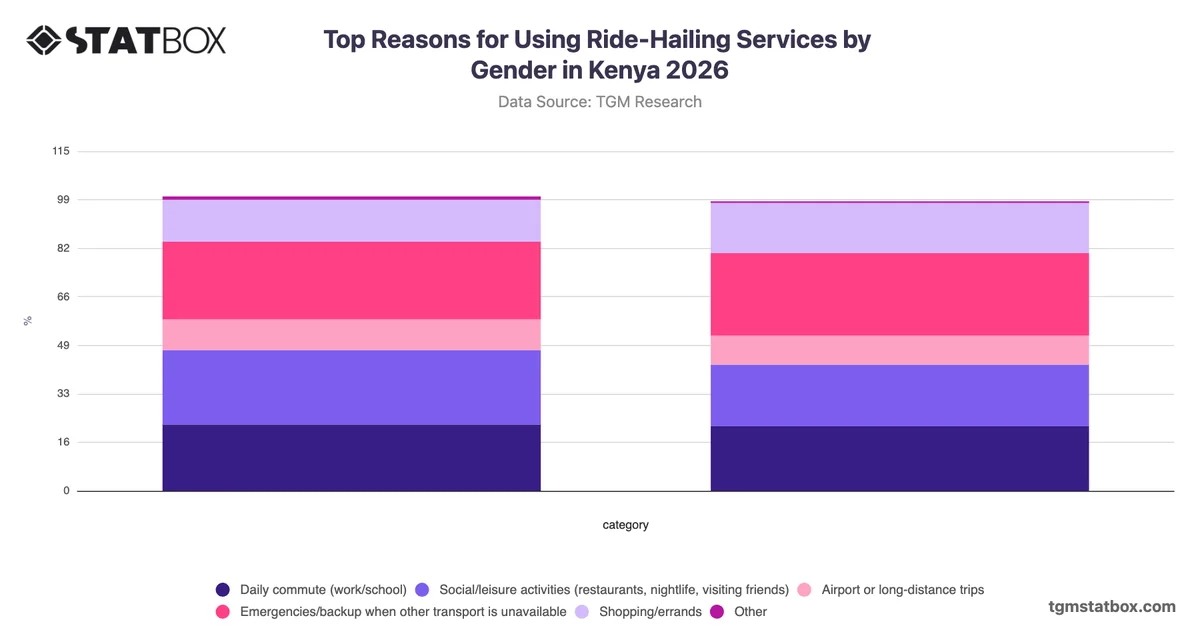
This chart examines how ride-hailing usage patterns in Kenya vary across different times of day, broken down by gender. Understanding when male and female riders are most active helps ride-hailing platforms make smarter decisions around driver availability, pricing strategies, and targeted promotions. For transport operators and advertisers, these time-based insights open direct opportunities to reach specific audiences at the moments they are most engaged. Overall, Kenyan ride-hailing demand follows a structured daily rhythm, with both genders showing broadly consistent peak periods that platforms can use to optimize service delivery and marketing spend.

AI-powered chart insight: This summary is automatically generated to help you understand the chart at a glance. It is intended as an overview; view the full chart and underlying data for complete context.

Related report

Would you like to know more?
Check our report on this topic

Charts library

Further Recommended Statistics

Statbox vector
The briefing
New data, in your inbox

Consumer insights, data stories and product updates as we publish them. No other mail, and one click to leave.

Roughly two emails a month.

Research services
Have a question our newsroom hasn't answered? Ask it directly.

Our team can run the study behind the story — in 60+ countries, on your question, with the data belonging to you.