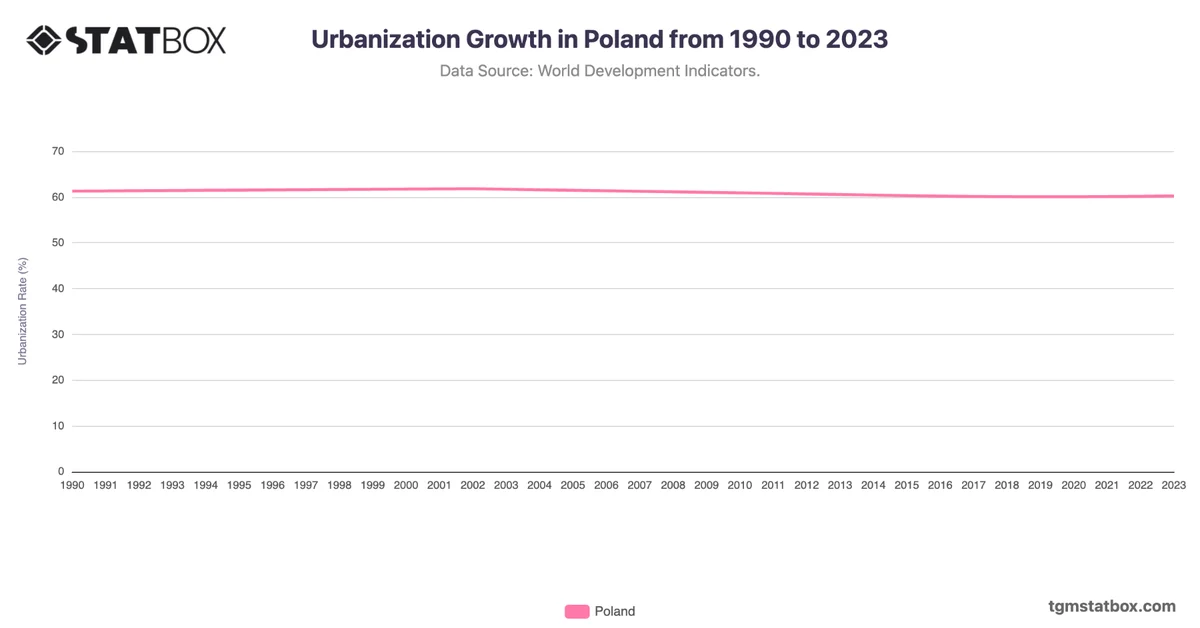
Poland's population density has remained relatively stable, fluctuating slightly around 124 people per square kilometer from 1990 to 2021. This stability is a result of balanced birth and death rates and limited urban migration. Urban centers like Warsaw and Krakow are densely populated, but rural areas experience little change, keeping the national average steady.
With a slight decrease in population density in recent years due to low birth rates and emigration, Poland’s population density reflects its balanced demographic structure. Future trends may show slight declines as the population ages, with density remaining concentrated in major urban areas.
With a slight decrease in population density in recent years due to low birth rates and emigration, Poland’s population density reflects its balanced demographic structure. Future trends may show slight declines as the population ages, with density remaining concentrated in major urban areas.
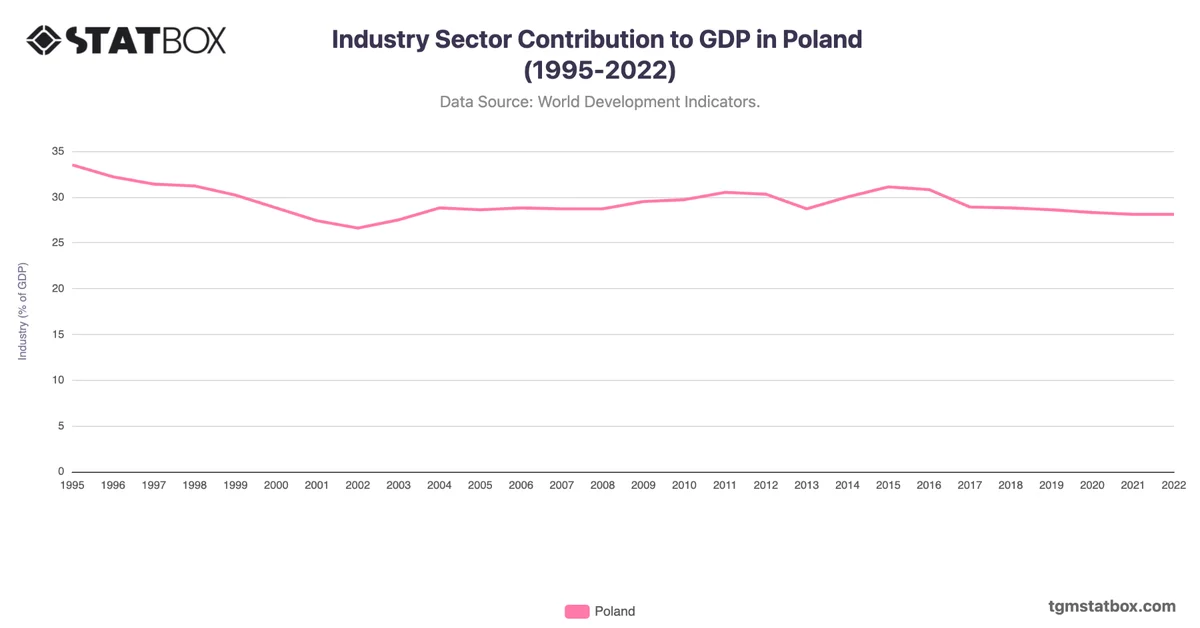
Explore related charts to gain a better understanding of Poland’s industry share in GDP, Poland’s population growth trend, military personnel ratio in Poland.