Charts library
Not sure where to start? Dive into a diverse selection of charts and data visualizations across topics, and find the information you need to drive your research and analysis.
 Pro
Pro
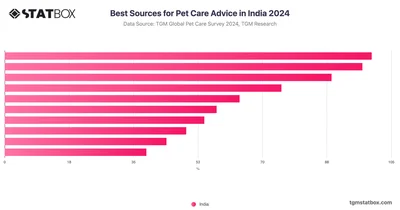
While veterinarians remain a trusted source of advice (44,72%), Indian pet owners show a particularly strong inclination towards social media and internet searches.
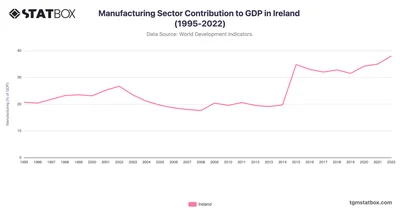
Ireland's manufacturing sector saw a notable rise in its contribution to GDP from 1995 onwards, peaking dramatically at 34.8% in 2015. See more data on TGM StatBox.
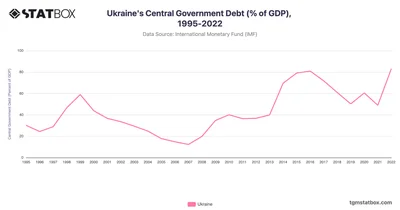
Ukraine’s debt peaked at 83.12% in 2022, driven by war-related borrowing. Explore more fiscal data, statistics and insights on TGM StatBox.
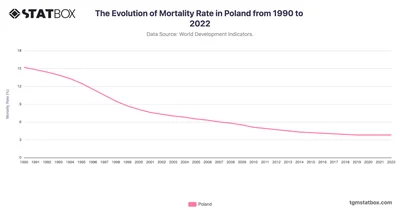
Poland’s mortality rate decreased from 15.2 in 1990 to 3.8 in 2022, driven by healthcare reforms and economic transition. Discover more insights on TGM StatBox.
 Pro
Pro
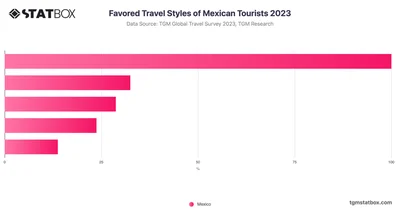
Mexican tourists primarily favor relaxation and discovery trips, while health and wellness trips and eco-solidarity trips also attract interest. Learn more on TGM StatBox.
 Pro
Pro
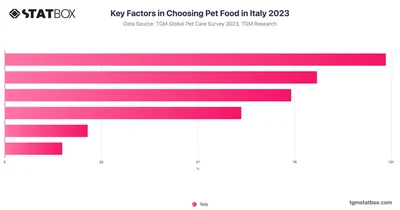
Quality leads Italian pet food preferences at 78.87% of consumer priority, followed by ingredient composition and price considerations.
 Pro
Pro
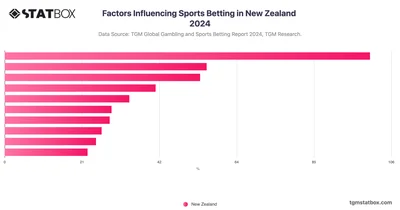
Analyze the key factors influencing sports betting in New Zealand, from cultural to economic drivers, in this comprehensive TGM Statbox chart.
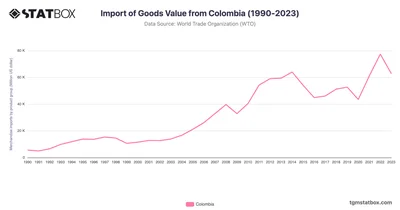
Colombia’s imports rose from $5.5B in 1990 to $77.4B in 2022, driven by industrialization and trade expansion. Discover more statistics and insights on TGM StatBox.
 Pro
Pro
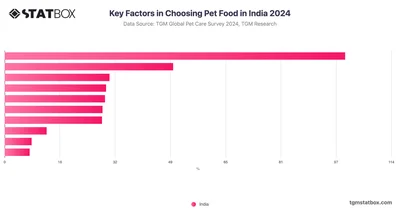
Quality (30.82%) is the top priority for Indian pet owners when selecting pet food, followed by professional advice, price, and availability.
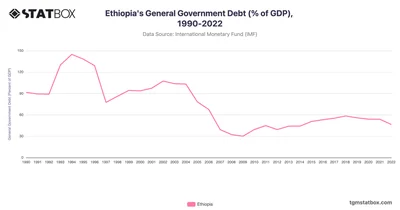
Ethiopia's government debt as a percentage of GDP has fluctuated significantly over the decades, shaped by economic reforms, political challenges, and more.
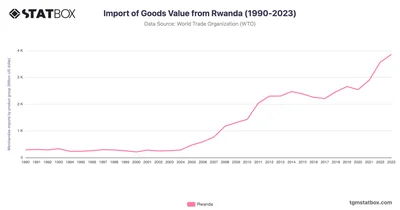
Rwanda's import of goods has demonstrated significant growth over the decades, reflecting its evolving economic landscape and increasing demand for foreign products.
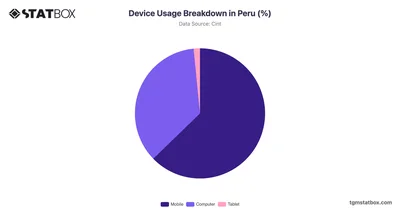
Peru exhibits a significant inclination towards mobile devices, with 62.74% of users relying on them. Discover more about device usage breakdown on TGM StatBox.
 Pro
Pro
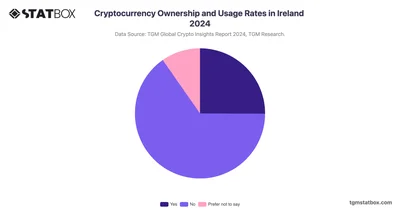
Only 25% of respondents have used cryptocurrency, while a significantly larger portion has never engaged with it, highlighting substantial barriers to its wider adoption.
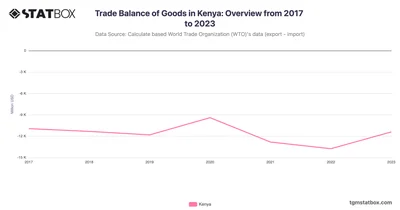
Kenya’s trade deficit narrowed in 2023 due to rising exports of tea and textiles, though import reliance persists. Discover more statistics and insights on TGM StatBox.
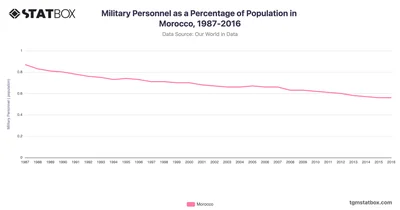
Morocco’s military personnel as a percentage of the population showed a gradual decrease from 1987 to 2016. Check full data on Morocco’s military personnel share on TGM StatBox.
 Pro
Pro
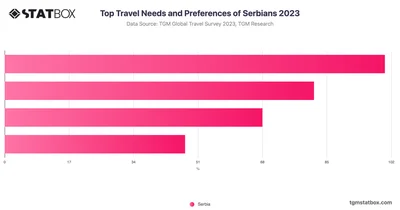
Serbian travelers prioritize "quality and comfort," with 59% highlighting its importance, a trend that aligns with global preferences in regions like APAC and Africa.
 Pro
Pro
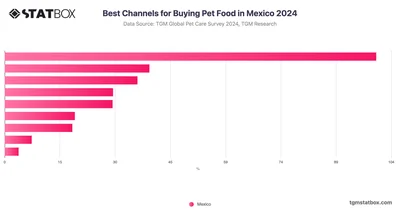
Supermarkets are the most popular channel for purchasing pet food in Mexico, with 67.27% of pet owners choosing this option.
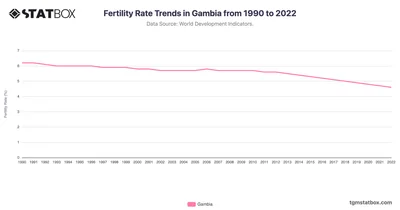
Discover fertility trends in Gambia from 1990 to 2022, emphasizing demographic transitions and cultural influences. Discover more statistics and insights on TGM StatBox.
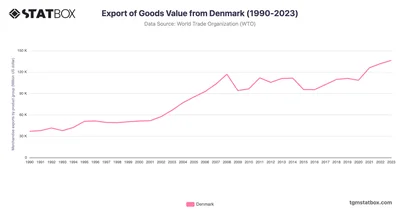
Discover Denmark's export trends from 1990 to 2023, emphasizing pharmaceuticals and agriculture. Discover more statistics and insights on TGM StatBox.
 Pro
Pro
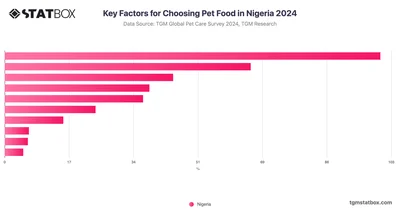
Nigerian pet owners demonstrate distinct priorities when selecting pet food. Quality leads as the primary concern, with 29.15% emphasizing its importance.
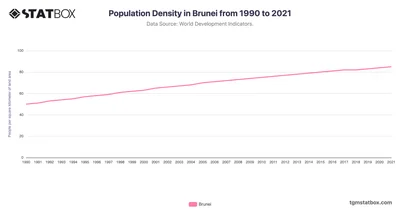
The chart shows an increase of 70% of Brunei’s population density over the 31-year period. See the full Brunei's population density data on TGM StatBox.
 Pro
Pro
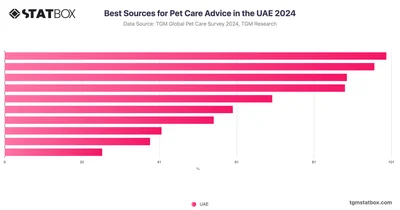
In the UAE, social media stands out as the most popular source for pet care advice, with 49.36% of pet owners relying on it.
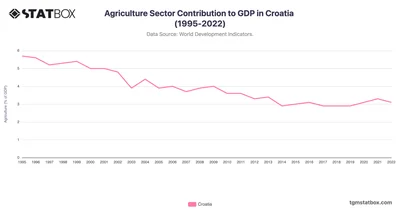
Croatia's agriculture sector’s contribution to GDP gradually decreased to around 3.1% by 2022. Discover the full Croatia's agriculture GDP data at TGM StatBox.
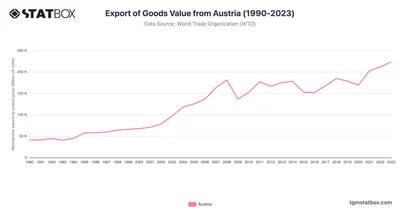
Delve into Austria's export performance from 1990 to 2023, supported by machinery and trade integration. Discover more statistics and insights on TGM StatBox.
 Pro
Pro
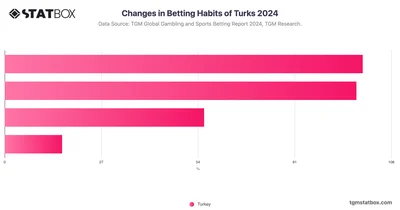
Track changes in betting habits among Turks, focusing on shifts in preferences and activities over time with this TGM Statbox chart.
 Pro
Pro
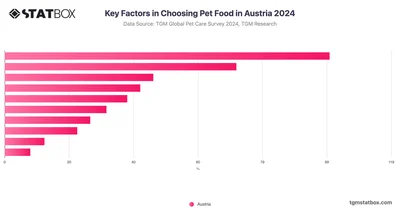
The three most important factors for Austrian pet owners when choosing pet food are quality, price, and the composition of ingredients.
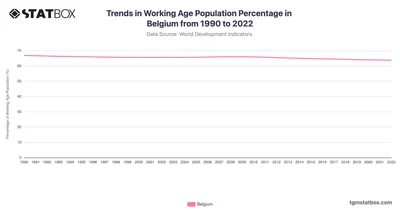
In Belgium, the working-age population showed a gradual decline from 66.9% in 1990 to 63.7% in 2022. Discover complete data of Belgium on TGM StatBox.
 Pro
Pro
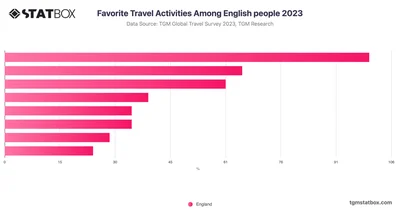
When it comes to travel activities, English citizens show a clear preference for beach and leisure activities, which rank the highest at 66%.
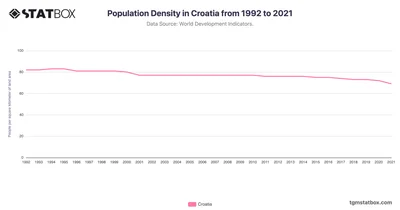
Croatia’s population density fluctuated between 82 and 77 people per square kilometer from 1992 to the early 2000s. Discover Croatia’s population density data on TGM StatBox.
 Pro
Pro
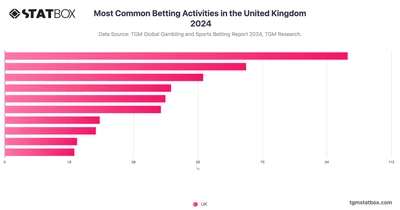
Explore the most common betting activities in the United Kingdom, including popular sports and casino games, through this detailed TGM Statbox chart.






