Charts library
Not sure where to start? Dive into a diverse selection of charts and data visualizations across topics, and find the information you need to drive your research and analysis.
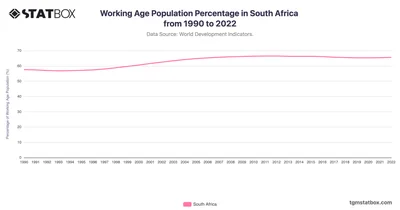
In South Africa, the working-age population percentage rose from 57.6% in 1990, peaking at around 66.5% in the early 2010s. Discover the complete data on TGM StatBox.
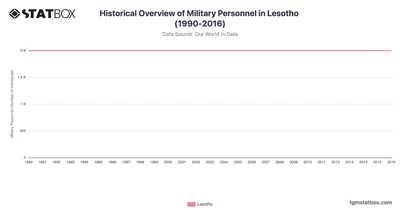
Lesotho maintained a constant military personnel level of 2,000 from 1990 to 2016, reflecting Lesotho’s limited defense budget and reliance on regional partnerships for security.
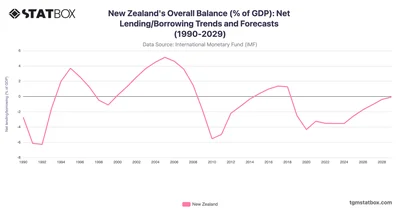
New Zealand’s fiscal position reflects resilience, with gradual deficit narrowing forecasted. Discover more statistics and insights on TGM StatBox.
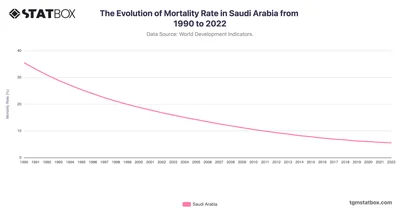
Saudi Arabia’s mortality rate declined from 35.5 in 1990 to 5.5 in 2022, driven by expanded healthcare access. Discover more statistics and insights on TGM StatBox.
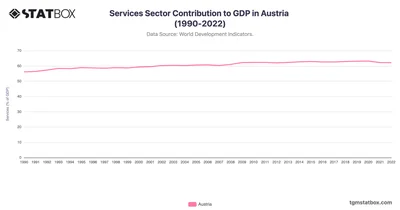
Austria’s services sector steadily grew, starting at 56.1% of GDP in 1990 and reaching 63.2% by 2020. Find more Austria’s GDP data on TGM StatBox.
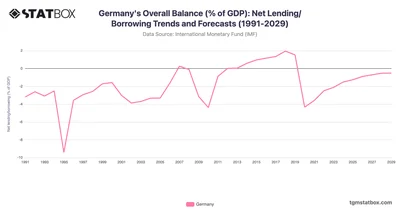
Germany’s fiscal balance shows recovery post-pandemic, with long-term stability expected. Discover more statistics and insights on TGM StatBox.
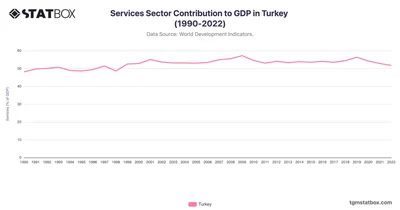
Turkey’s services sector gradually expanded from 48.1% in 1990 to 57.2% in 2009, driven by tourism, finance, and retail growth. Find more data on TGM StatBox.
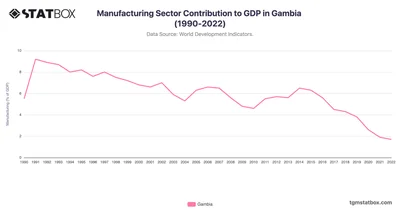
Gambia’s manufacturing sector displayed a declining trend, from a peak of 9.2% in 1991 to just 1.7% by 2022. See more Gambia’s data over the years on TGM StatBox.
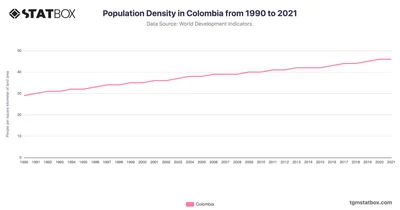
Colombia's population density rose from 29 to 46 people per square kilometer, showing a steady upward trend driven by urban migration and population growth.
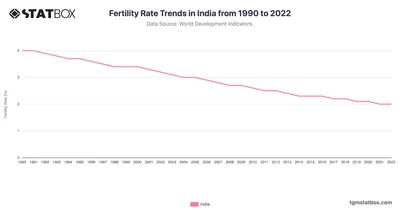
Analyze India's fertility trends from 1990 to 2022, highlighting population growth influenced by economic and policy changes. Discover more statistics and insights on TGM StatBox.
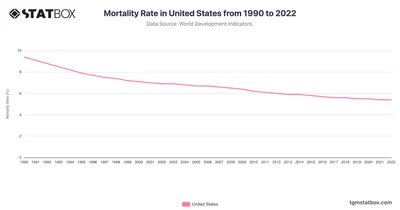
US mortality rate declined from 9.4 in 1990 to 5.4 in 2022, highlighting progress in healthcare access and innovation. Discover more insights on TGM StatBox.
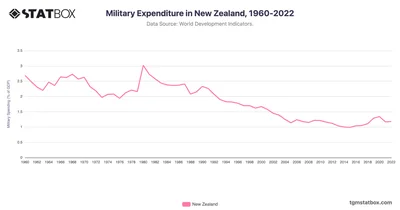
New Zealand's defense spending stabilized at 1.2% in 2022, focusing on peacekeeping. Explore more statistics and insights on TGM StatBox.
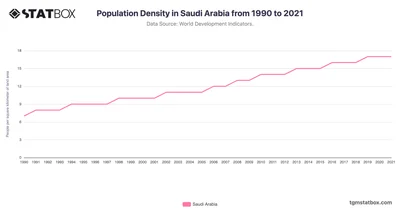
Saudi Arabia’s population density increased from 7 people per square kilometer in 1990 to 17 by 2021. See the full Saudi Arabia’s population density data on TGM StatBox.
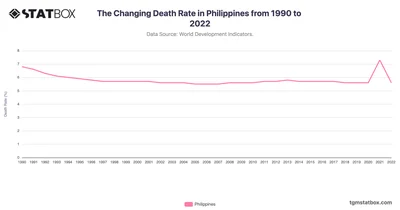
The Philippines’ death rate trends underline healthcare progress and persistent health challenges. Discover more statistics and insights on TGM StatBox.
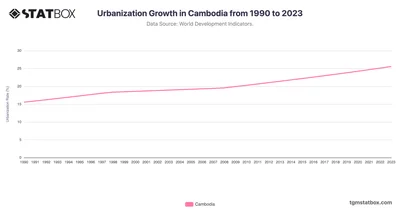
Cambodia’s urbanization rate increased from 15.5% in 1990 to 25.6% in 2023, indicating a steady rise in urban migration over the years. Discover more on TGM StatBox.
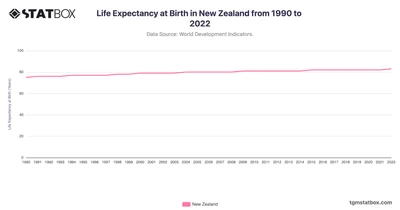
New Zealand’s life expectancy increased from 75 in 1990 to 83 in 2022, reflecting sustained healthcare advancements. Discover more statistics and insights on TGM StatBox.
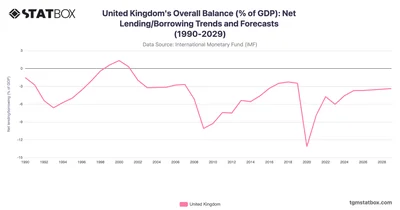
The UK’s fiscal challenges persist post-pandemic, with gradual improvement projected. Discover more statistics and insights on TGM StatBox.
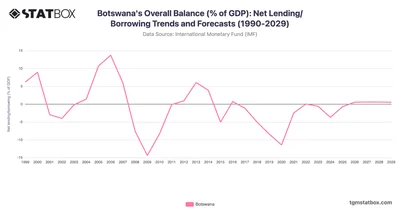
Botswana’s fiscal journey includes sharp swings from surpluses to deficits, influenced by commodity cycles and reforms. Discover more statistics and insights on TGM StatBox.
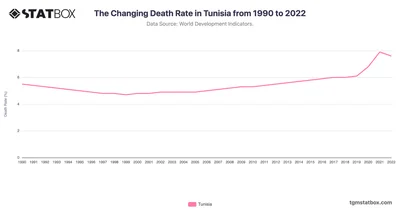
Tunisia’s death rate evolution highlights healthcare gains and ongoing challenges. Discover more statistics and insights on TGM StatBox.
 Pro
Pro
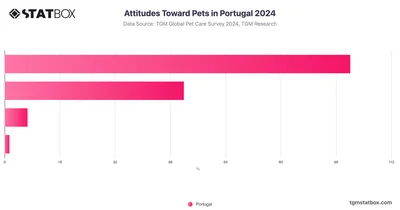
In Portugal, the prevailing attitude toward pets is predominantly positive, with 62.57% of respondents expressing that they "like them all."
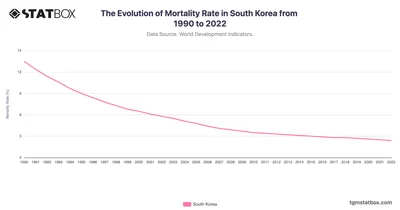
South Korea’s mortality rate fell from 13.5 in 1990 to 2.4 in 2022, highlighting exceptional public health progress. Discover more insights on TGM StatBox.
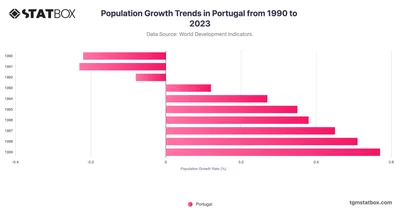
Understand Portugal’s population growth marked by aging and migration challenges. Discover more statistics and insights in your target country on TGM StatBox.
 Pro
Pro
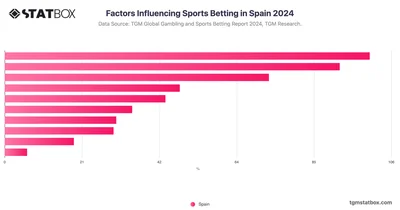
Examine the factors influencing sports betting in Spain, from cultural drivers to market trends, in this comprehensive TGM Statbox chart.
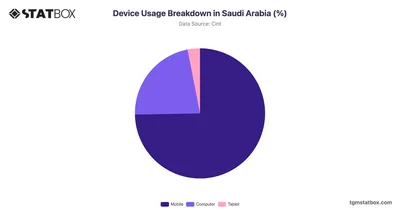
Explore device usage breakdown in Saudi Arabia, showcasing percentage distribution of smartphones, tablets, desktops. Analyze the trends shaping digital habits.
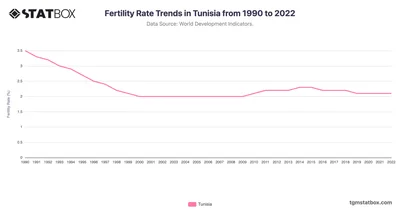
Examine Tunisia's fertility rate shifts from 1990 to 2022, showcasing demographic transitions in North Africa. Discover more statistics and insights on TGM StatBox.
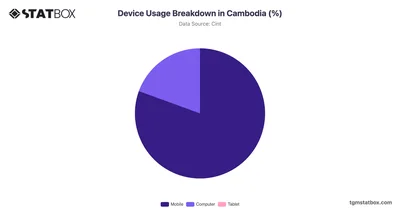
Cambodia leads with 80.56% of its population using mobile devices. Discover more about device usage breakdown in Cambodia, now on TGM StatBox.
 Pro
Pro
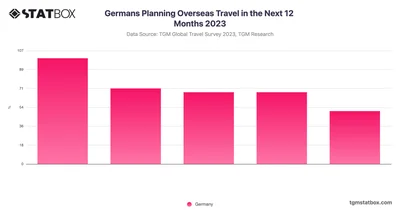
13.93% of Germans are very likely to travel overseas for leisure in the next 12 months. This is significantly lower compared to other countries like Saudi Arabia and UAE.
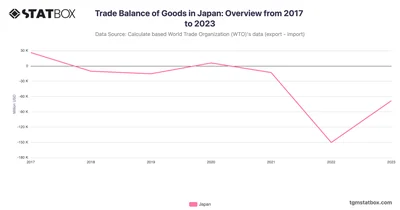
Japan’s trade deficit narrowed in 2023 as energy import costs eased and exports partially recovered. Discover more statistics and insights on TGM StatBox.
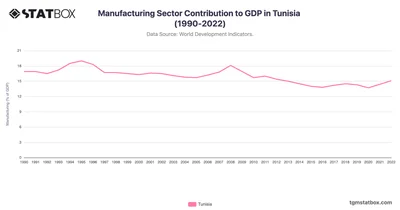
Tunisia's manufacturing sector fluctuated from 16.9% in 1990, peaking at 19% in 1995, before stabilizing around 14-15% in recent years. See more data on TGM StatBox.
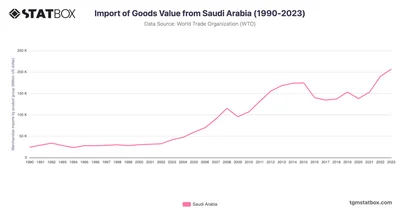
Saudi Arabia’s imports grew from $24B in 1990 to $206.9B in 2023, highlighting energy and consumer demand. Discover more statistics and insights on TGM StatBox.






