Charts library
Not sure where to start? Dive into a diverse selection of charts and data visualizations across topics, and find the information you need to drive your research and analysis.
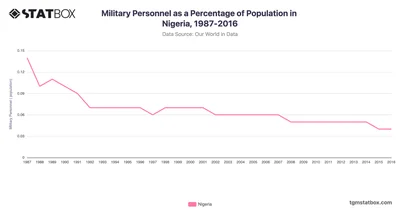
In Nigeria, the proportion of military personnel relative to the population remained consistently low from 1987 to 2016. Check full data on TGM StatBox.
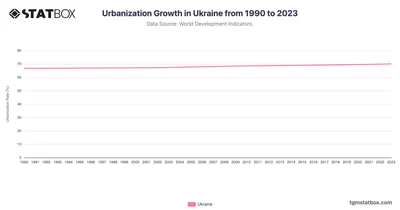
From 1990 to 2023, Ukraine’s urbanization rate grew gradually from 66.8% to 70.1%, showing a slow yet steady increase. Discover the complete data on TGM StatBox.
 Pro
Pro
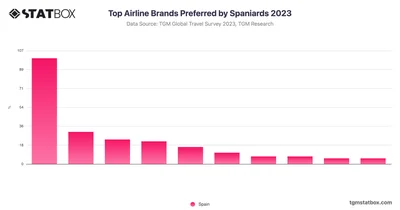
Iberia stands out as the overwhelmingly preferred airline brand among Spanish travelers, with 55.9% of respondents indicating it as their favorite.
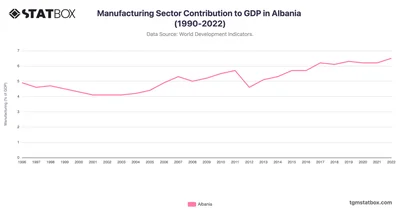
Albania’s manufacturing sector experienced gradual growth in its contribution to GDP from 4.9% in 1996 to a peak of 6.5% in 2022. See more data on TGM StatBox.
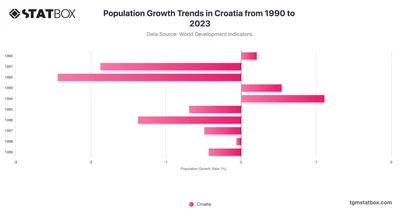
Dive into Croatia's population trends, shaped by migration and aging. Discover more statistics and insights in your target country on TGM StatBox.
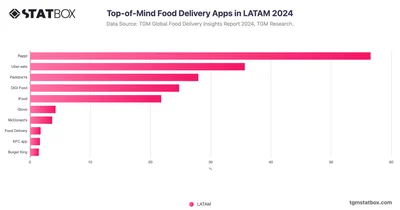
Rappi (56.6%) tops LATAM’s food delivery awareness, followed by Uber Eats, PedidosYa, DiDi Food, and iFood—each strong in specific regional markets.
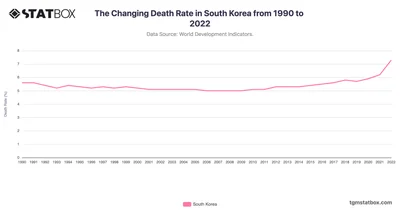
South Korea’s death rate trends reflect demographic shifts and public health initiatives. Discover more statistics and insights on TGM StatBox.
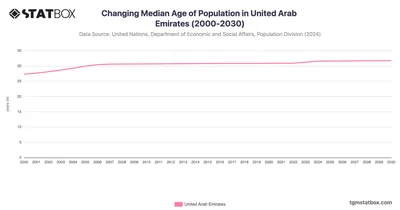
The UAE saw its median age rise moderately from 27.3 years in 2000 to an estimated 31.8 years by 2030. Discover more about median age in the UAE on TGM StatBox.
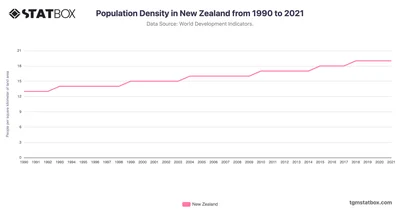
New Zealand's population density has remained relatively low, increasing from 13 people per square kilometer in 1990 to 19 in 2021. See the full data on TGM StatBox.
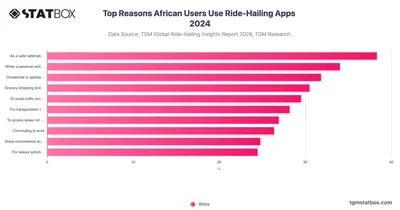
38.32% of African respondents use ride-hailing as a safer alternative, particularly when going out for events or gatherings, especially at night.
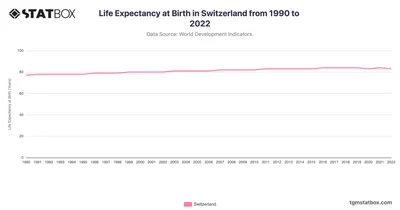
Switzerland’s life expectancy grew from 77 in 1990 to 83 in 2022, reflecting sustained healthcare excellence. Discover more statistics and insights on TGM StatBox.
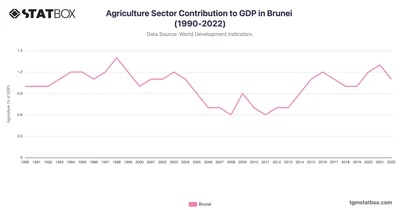
Brunei’s agriculture GDP remains minimal amid oil and gas dominance. Discover the full Brunei’s agriculture GDP data at TGM StatBox.
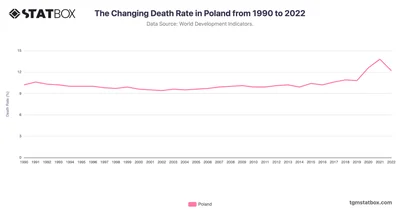
Poland’s death rate reflects demographic shifts and healthcare system improvements. Discover more statistics and insights on TGM StatBox.
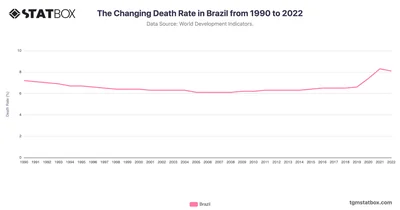
Brazil's death rate evolution highlights public health progress and ongoing challenges. Discover more statistics and insights on TGM StatBox.
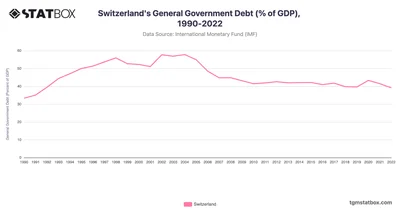
Switzerland’s general government debt ratio rose moderately in the early 1990s, from 33.3% in 1990 to around 56% by 1998. Discover more statistics on TGM StatBox.
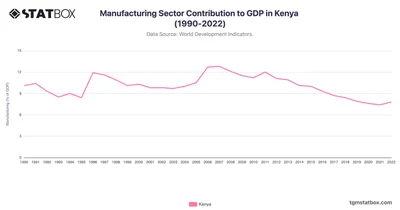
Kenya's manufacturing sector showed consistent activity, reaching its highest contribution of 12.8% in 2007. See more Kenya's data over the years on TGM StatBox.
 Pro
Pro
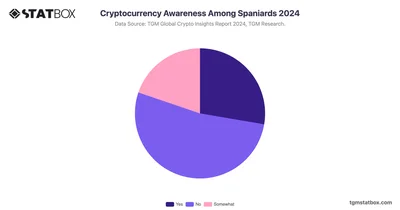
With roughly 27.7% of Spaniards being familiar with it, a large majority remains either unfamiliar or only partially familiar.
 Pro
Pro
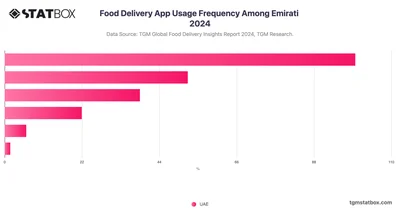
In the UAE, food delivery apps are part of daily life—69% order weekly and 10% daily, showing strong engagement in a fast-paced, convenience-driven market.
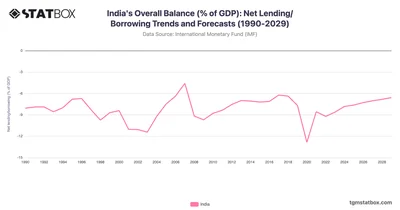
India’s deficits reflect public investments, with gradual narrowing expected despite economic challenges. Discover more statistics and insights on TGM StatBox.
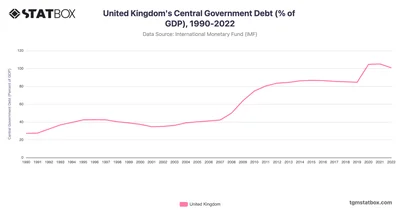
The UK’s debt peaked at 105.1% in 2021, easing to 100.75% in 2022 amid recovery efforts. Discover more statistics and insights on TGM StatBox.
 Pro
Pro
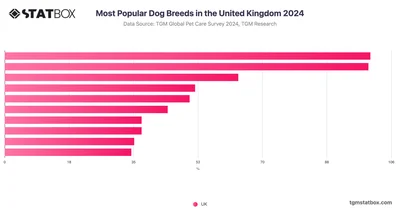
The German Shepherd and Labrador Retriever are nearly tied as the most popular dog breeds in the United Kingdom, each representing around 11% of dog ownership.
 Pro
Pro
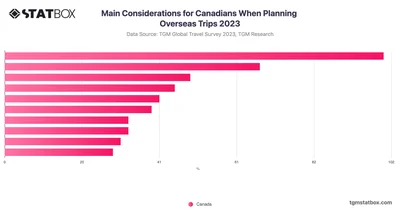
Cost emerges as the primary concern for Canadian travelers, with 49% prioritizing affordability when planning their international trips.
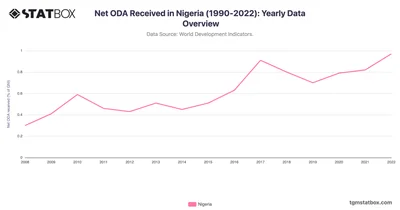
Nigeria’s Net ODA rose from 0.3% in 2008 to 1% in 2022, reflecting targeted donor programs. Discover more statistics on TGM StatBox.
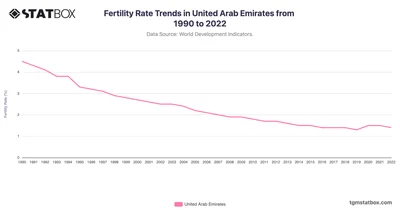
Track UAE's fertility patterns from 1990 to 2022, highlighting unique demographic transitions in the region. Discover more statistics and insights on TGM StatBox.
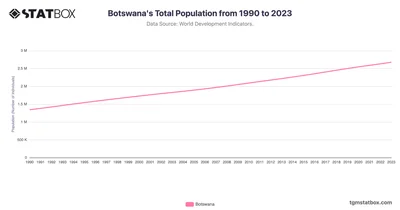
Botswana's population grew to approximately 2.67 million in 2023. Learn more about Botswana's population changes over the decades on TGM StatBox.
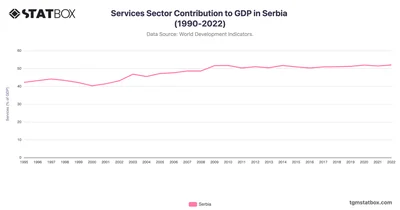
In Serbia, the services sector expanded from 42.2% in 1995 to around 51% in the 2010s. Find more Serbia’s GDP data over the years on TGM StatBox.
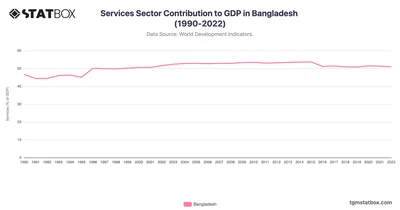
Bangladesh’s Services sector grew from 46.7% in 1990 to a peak of 53.7% in 2015, driven by growth in telecommunications and retail. Find more data on TGM StatBox.
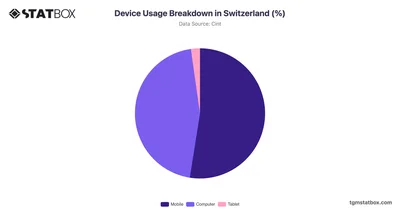
Explore device usage breakdown in Switzerland, showcasing percentage distribution of smartphones, tablets, desktops. Analyze the trends shaping digital habits.
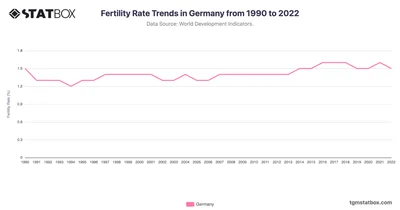
Explore Germany's fertility rates from 1990 to 2022, reflecting demographic shifts in Europe’s largest economy. Discover more statistics and insights on TGM StatBox.
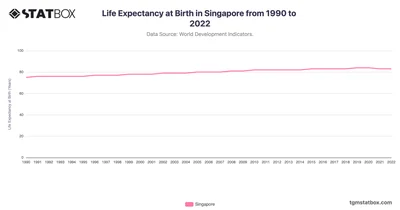
Singapore’s life expectancy rose from 75 in 1990 to 84 in 2022, showcasing world-class healthcare systems. Discover more statistics and insights on TGM StatBox.






