Charts library
Not sure where to start? Dive into a diverse selection of charts and data visualizations across topics, and find the information you need to drive your research and analysis.
 Pro
Pro
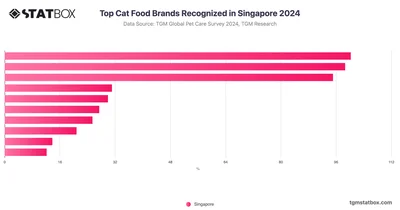
In Singapore, the top three brands of cat food recognized by pet owners are Purina Friskies (31.3%), Whiskas (30.8%), and Royal Canin (29.7%).
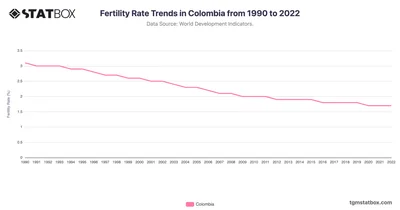
Track Colombia's fertility shifts from 1990 to 2022, showcasing demographic transitions influenced by policy reforms. Discover more statistics and insights on TGM StatBox.
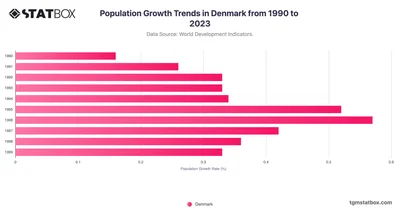
Explore Denmark's population growth, highlighting urbanization and aging impacts. Discover more statistics and insights in your target country on TGM StatBox.
 Pro
Pro
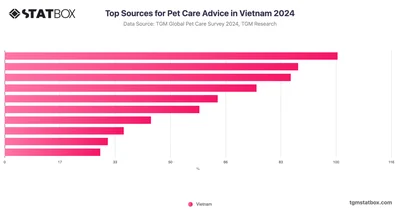
In Vietnam, 60% of pet owners trust veterinarians for pet care advice, with social media and internet searches also being popular sources.
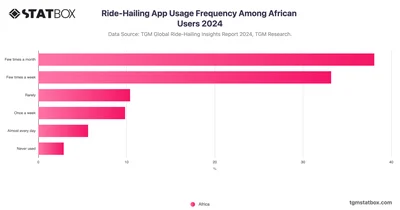
A combined 48.65% of users use ride-hailing almost every day, a few times a week, or once a week, typically for commuting, running errands, or occasional travel.
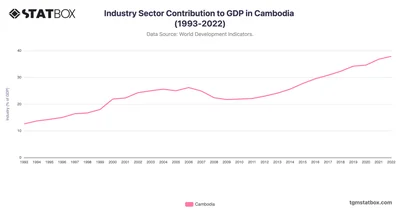
Cambodia’s industry sector contribution to GDP rose steadily from 12.6% in 1993 to 37.9% in 2022. Find more data about Cambodia on TGM StatBox.
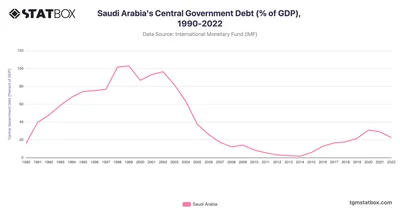
Saudi Arabia’s debt peaked at 31.04% in 2020, easing to 22.57% by 2022 amid reforms. Learn more statistics and insights on TGM StatBox.
 Pro
Pro
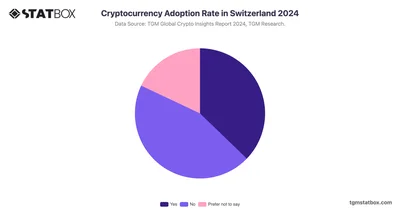
37.2% of Swiss respondents have used cryptocurrency, while a significant portion has not, showing that adoption is growing but not yet mainstream in Switzerland.
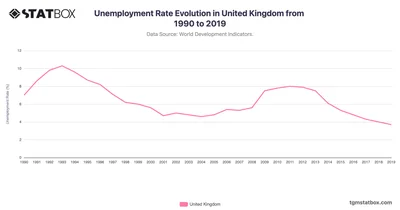
The UK’s unemployment rate rose sharply in the early 1990s due to a recession, reaching a peak of 10.3% in 1993. Discover more statistics and insights on TGM StatBox.
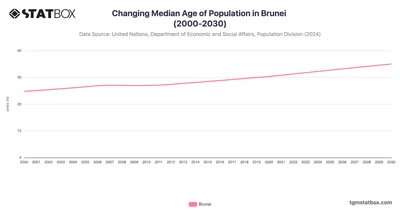
Brunei Darussalam's median age has steadily increased from 24.8 in 2000 to a projected 35.0 by 2030. Discover more about median age in Brunei on TGM StatBox.
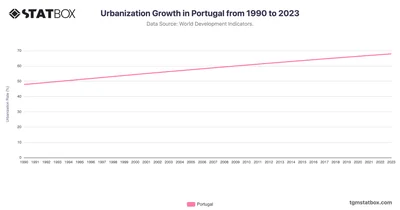
Portugal’s urbanization rate increased significantly from 47.9% in 1990 to 67.9% in 2023, driven by economic integration with the European Union and the development of urban centers.
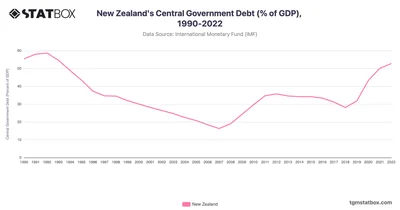
New Zealand's debt rose to 52.79% in 2022, up from 43.34% in 2020, driven by pandemic spending. Discover more statistics and insights on TGM StatBox.
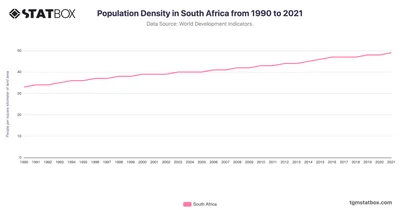
South Africa’s population density increased from 33 people per square kilometer in 1990 to 49 by 2021. See the full South Africa’s population density data on TGM StatBox.
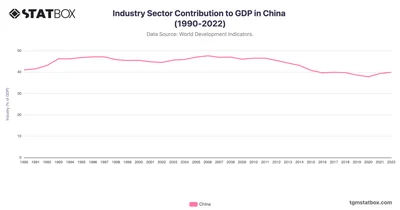
China’s industrial contribution to GDP remained robust from 1990, peaking at 47.6% in 2006. Find more data about China industrial contribution to GDP on TGM StatBox.
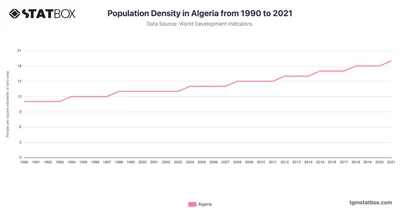
From 1990 to 2021, Algeria’s population density has shown a steady increase. Explore the full data on Algeria's population density over the decades on TGM StatBox.
 Pro
Pro
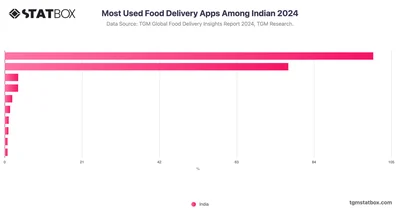
The Indian food delivery landscape is dominated by two major players: Zomato, used most often by 47.7% of respondents, and Swiggy, which is close behind.
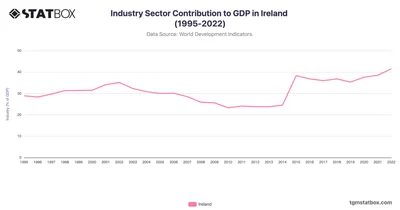
Ireland's industry sector contribution surged in 2015 to 38.3%, largely due to foreign direct investment, especially in pharmaceuticals and technology.
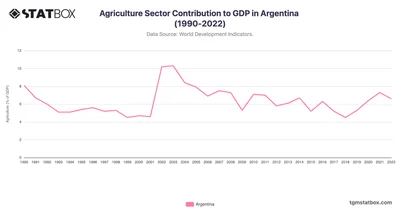
Argentina’s agriculture GDP fluctuates amid export demand and economic volatility. Full Argentina’s agriculture GDP data at TGM StatBox.
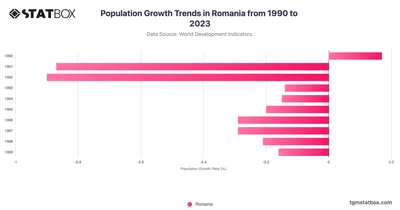
Dive into Romania’s population trends, shaped by migration and declining fertility. Discover more statistics and insights in your target country on TGM StatBox.
 Pro
Pro
Identify the leading online betting platforms in South Africa, offering insights into the most popular platforms and their market share with this TGM Statbox chart.
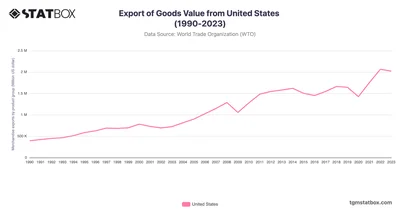
Discover the US export trends from 1990 to 2023, showcasing technology and agriculture. Discover more statistics and insights on TGM StatBox.
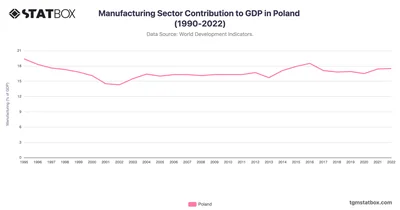
Poland’s manufacturing sector has shown resilience, beginning at 19.4% in 1995 and ending at 17.5% in 2022. See more Poland’s GDP data on TGM StatBox.
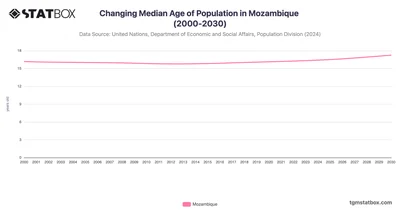
The median age of Mozambique's population has remained relatively stable from 2000 to 2015. Discover more about median age in Mozambique on TGM StatBox.
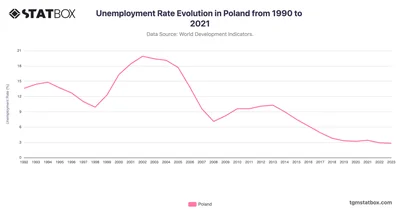
Poland’s unemployment rate experienced extreme highs and lows over the years, particularly in the early 2000s. Discover more statistics and insights on TGM StatBox.
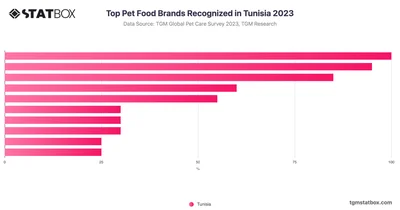 Pro
Pro
The top three most recognized pet food brands are Whiskas leading at 20% of respondents, followed closely by Pedigree at 19%, and Felix ranking third.
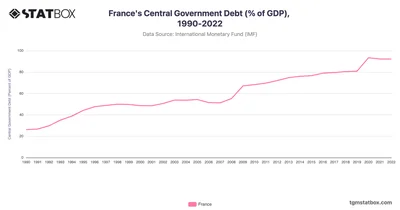
France’s debt peaked at 93.38% in 2020, stabilizing at 92.15% in 2022 amid fiscal efforts. Explore more statistics and insights on TGM StatBox.
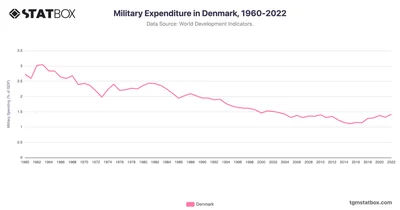
Denmark's military spending steadied at 1.4% in 2022, aligning with NATO goals. Find more statistics and insights on TGM StatBox.
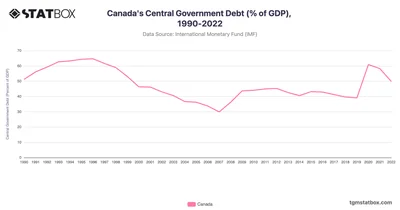
Canada’s debt hit 64.69% in 1996, fell to 29.9% in 2007, and rose to 49.83% by 2022. Explore fiscal details, more statistics and insights on TGM StatBox.
 Pro
Pro
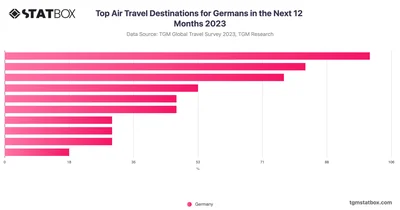
17% of Germans plan to travel to Western Europe by plane in 2023, some are interested in Southern Europe and the Balkans. Explore more data and insights on TGM StatBox.
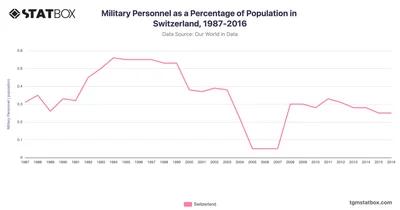
Switzerland's military personnel as a percentage of its population exhibited fluctuations from 1987 to 2016. Discover data on Switzerland's military personnel share on TGM StatBox.






