Insights library
Explore a wide range of consumer insights and statistics across industries. Discover charts on behaviors, preferences, attitudes, and market trends to find the data most relevant to your research and decision-making.
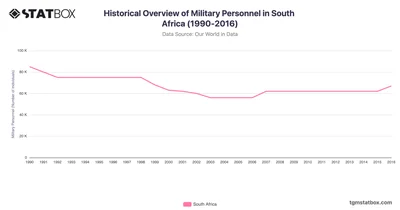
South Africa’s military personnel numbers reflect the country’s political transformation and strategic shifts. Discover more statistics and insights on TGM StatBox.
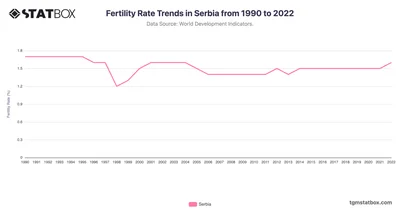
Explore Serbia's fertility rates from 1990 to 2022, reflecting demographic transitions in a developing region. Discover more statistics and insights on TGM StatBox.
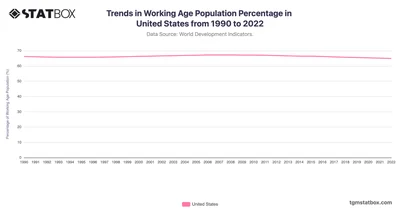
The United States had a relatively stable working-age population percentage through the 1990s and early 2000s, hovering around 66-67%. Discover on TGM StatBox.
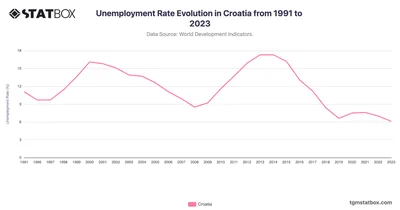
Croatia’s unemployment rate reflects its transition from a war-impacted economy in the 1990s to a stable member of the European Union. Discover more statistics on TGM StatBox.
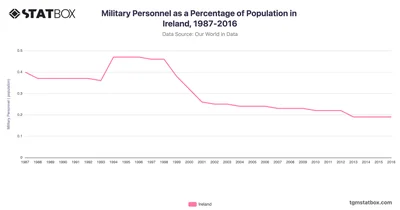
From 1987 to 2016, Ireland’s military personnel as a percentage of the population demonstrated a gradual decline. Discover data on Ireland’s military personnel share on TGM StatBox.
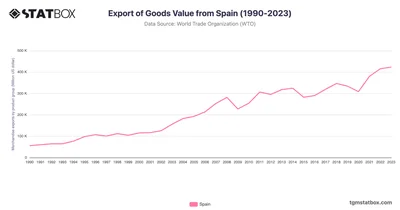
Examine Spain's export growth from 1990 to 2023, showcasing its wine and automotive industries. Discover more statistics and insights on TGM StatBox.
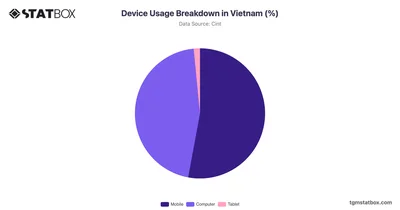
Discover the detailed breakdown of device usage in Vietnam, with percentage insights into the prevalence of smartphones, tablets, and desktops in daily life.
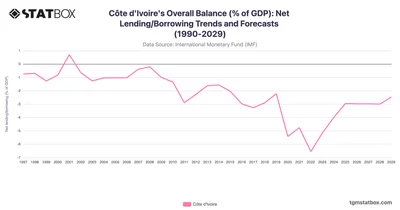
Côte d'Ivoire’s fiscal trends reflect investment in infrastructure and economic recovery post-conflict. Discover more statistics and insights on TGM StatBox.
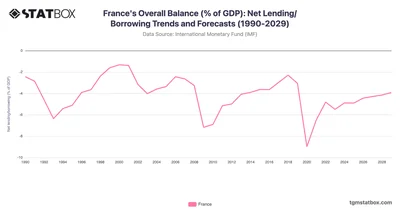
France’s fiscal deficits persist post-pandemic, highlighting challenges in structural reforms. Discover more statistics and insights on TGM StatBox.
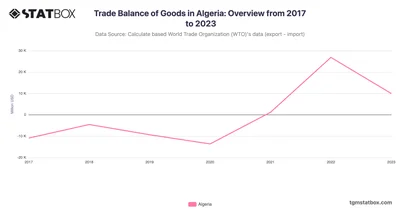
Algeria's trade balance soared from a deficit in 2017 to a surplus in 2022 due to strong hydrocarbon exports. Discover more statistics and insights on TGM StatBox.
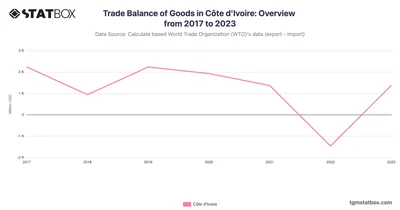
Côte d’Ivoire saw trade surpluses disrupted in 2022 before rebounding in 2023, driven by exports of cocoa and oil. Discover more statistics and insights on TGM StatBox.
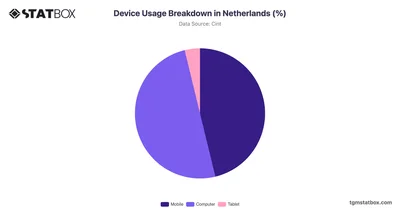
Explore device usage breakdown in the Netherlands, showcasing percentage distribution of smartphones, tablets, desktops. Analyze the trends shaping digital habits.
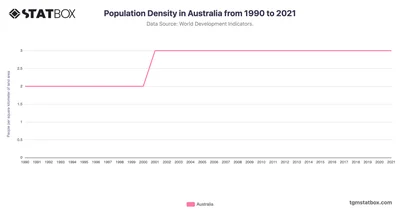
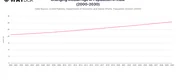
The chart shows the minimal change in Australia’s population density from 1990 to 2021. See the full Australia's population density data on TGM StatBox.
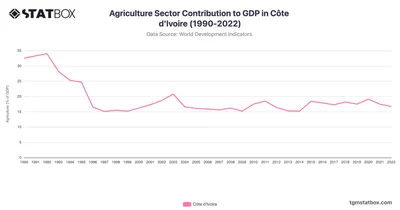
The agriculture sector in Côte d'Ivoire has shown volatility, starting with a high 32.5% contribution to GDP in 1990. Discover the full Côte d'Ivoire’s data at TGM StatBox.
 Pro
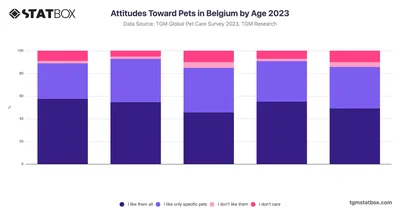
Among Belgians aged 18-24, 57% express a universal fondness for pets. This trend slightly decreases in older age groups, with 53% for 25-34-year-olds and 45% for those aged 35-44.
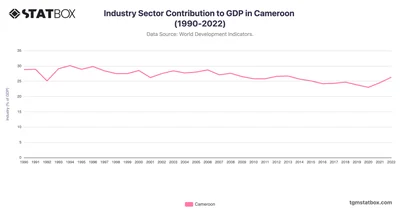
Cameroon’s industry sector has shown a relatively stable contribution, starting at 28.8% in 1990. Find more data about Cameroon on TGM StatBox.
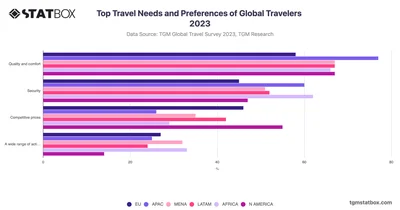
Travelers prioritize quality and comfort as their top requirement when planning trips, with an overall total of 64% across various regions.
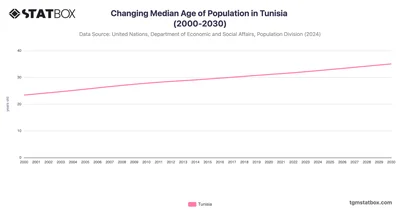
Tunisia’s median age increased steadily from 23.4 years in 2000 to a forecasted 35.1 years by 2030. Discover more about median age in Tunisia on TGM StatBox.
 Pro
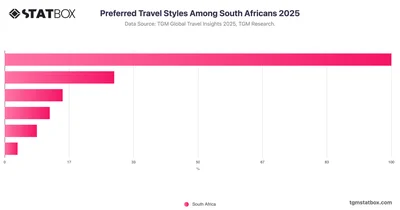
Relaxation still leads for South Africans in 2025, but adventure and wellness trips are rising as travelers seek purpose and escape. Full data on StatBox.
 Pro
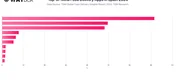
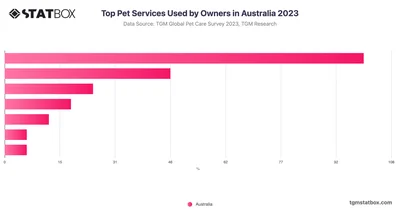
Veterinarian services are the most popular among Australian pet owners, with 65% relying on them for their pets' healthcare and maintenance.
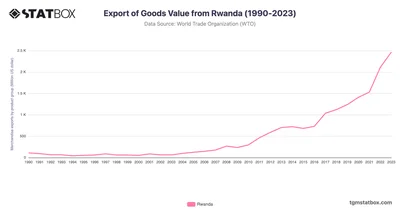
Rwanda's export growth has been driven by diversification into minerals, coffee, and tea exports, alongside strategic investments in technology and infrastructure.
 Pro
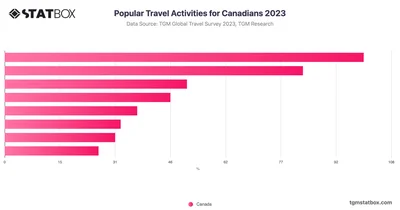
Beach and leisure activities dominate the preferences of Canadian travelers, with 65% indicating these as their primary interests. Retail therapy also plays a significant role.
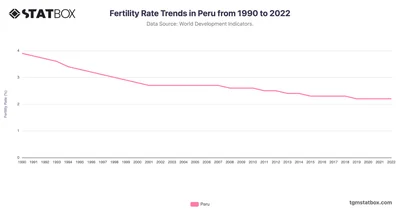
Discover Peru's fertility trends from 1990 to 2022, reflecting population changes influenced by socio-economic growth. Discover more statistics and insights on TGM StatBox.
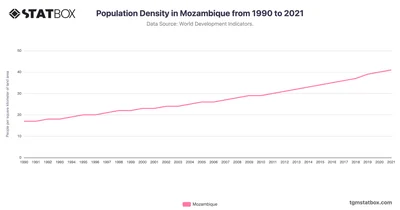
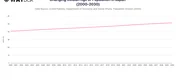
The chart reflects a significant growth in Mozambique's population density, indicating population growth and urbanization over decades. Explore the full data on TGM StatBox.
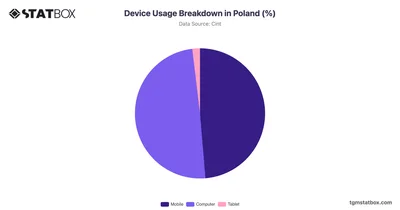
Explore device usage breakdown in Poland, showcasing percentage distribution of smartphones, tablets, desktops. Analyze the trends shaping digital habits.
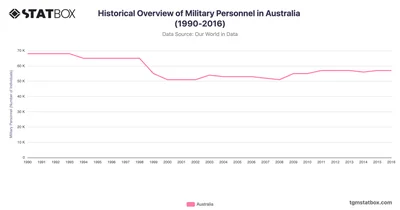
Australia's military personnel consistently declined from 68,000 in 1990 to 51,000 by 2000. Discover more Australia's statistics and insights on TGM StatBox.
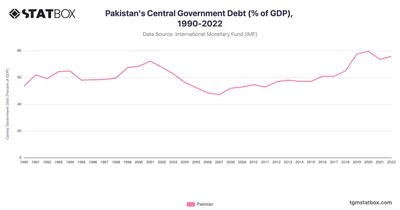
Pakistan’s debt peaked at 79.56% in 2020, easing to 75.75% by 2022 amid fiscal challenges. Learn more statistics and insights on TGM StatBox.
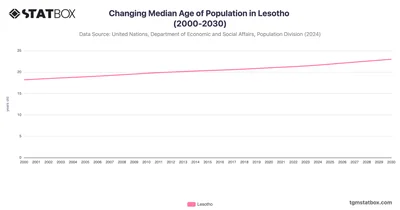
The median age of Lesotho's population is projected to rise to approximately 23.0 years by 2030. Discover more about median age in Lesotho on TGM StatBox.
 Pro
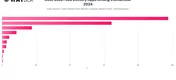
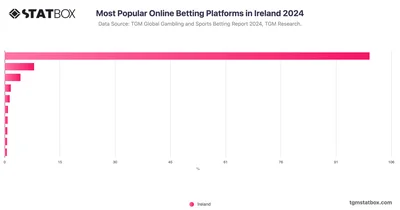
In Ireland, Paddy Power stands out as the most recognized online betting platform, with a commanding 66.1% of respondents identifying it as the top choice.
 Pro
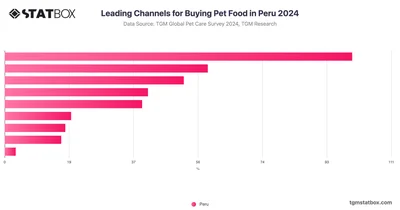
In Peru, pet owners primarily purchase pet food through various channels, with supermarkets being the most popular choice, accounting for 53.93% of purchases.