Insights library
Explore a wide range of consumer insights and statistics across industries. Discover charts on behaviors, preferences, attitudes, and market trends to find the data most relevant to your research and decision-making.
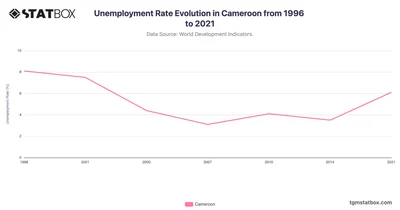
Cameroon’s unemployment rate declined significantly from 8.1% in 1996 to 3.1% in 2007. Discover the change of Cameroon’s unemployment rate over decades on TGM StatBox.
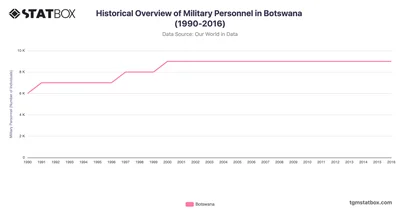
Botswana's military personnel levels exhibited steady growth during the 1990s and early 2000s. Discover more Botswana's statistics and insights on TGM StatBox.
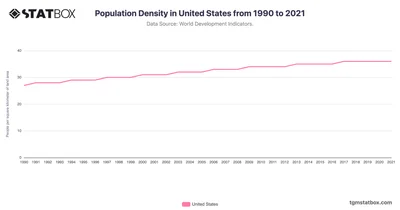
The United States experienced a gradual increase in population density to 36 people per square kilometer in 2021. See the full USA's population density data on TGM StatBox.
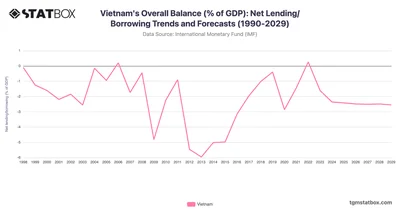
Vietnam’s fiscal performance reflects growth and resilience, with deficits stabilizing long-term. Discover more statistics and insights on TGM StatBox.
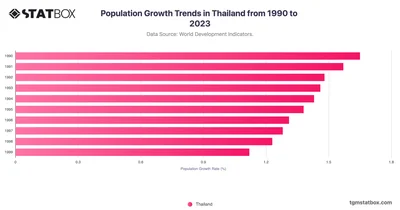
Explore Thailand’s population trends, reflecting aging and urbanization. Discover more statistics and insights in your target country on TGM StatBox.
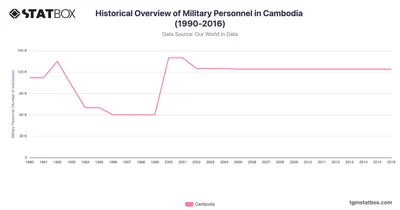
Cambodia’s military personnel levels reflected periods of conflict and stabilization. Discover more Cambodia’s statistics and insights on TGM StatBox.
 Pro
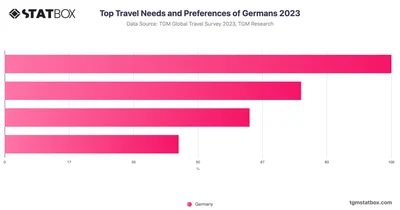
German travelers prioritize quality and comfort, with 60% emphasizing these needs, slightly above the European average, reflecting a strong preference for comfort.
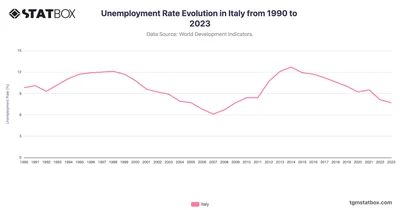
Italy’s unemployment rate fluctuated widely from the 1990s onwards, influenced by economic cycles, labor policies, and external economic pressures.
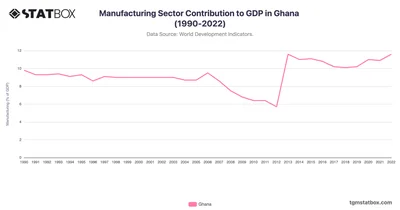
Ghana’s manufacturing sector saw moderate contribution stability, with a slight decline from 9.8% in 1990 to 6.4% by 2010. See more Ghana’s data on TGM StatBox.
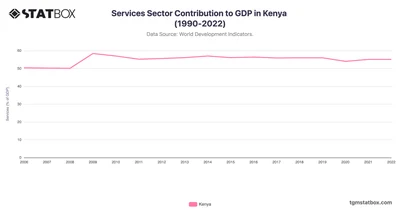
In Kenya, the services sector’s share grew from 50.4% in 2006, peaking at 58.4% in 2009. Find more Services Contribution to GDP data over the decades on TGM StatBox.
 Pro
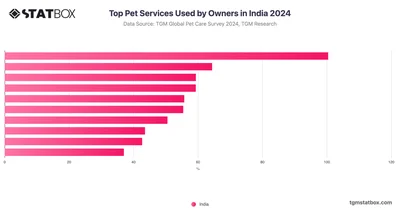
Professional grooming is the second most popular service at 29.67%, followed closely by visits to feed pets while owners are away at 29.66%.
 Pro
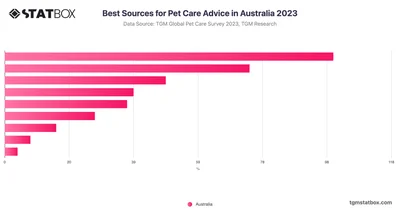
In Australia, 51.38% rely on veterinarians for pet care advice, highlighting their trust in these experts' specialized knowledge and direct interaction.
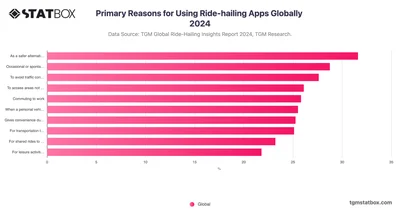
31.6% of global respondents, is using ride-hailing apps as a safer alternative when going out for events or gatherings, especially at night.
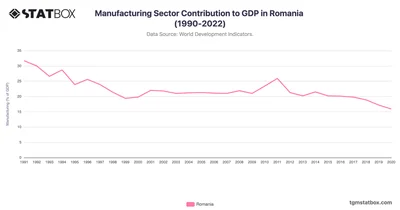
The decrease of Manufacturing Sector Contribution to GDP in Romania underscores its need to balance industrial growth with modernization challenges as part of the EU economic structure.
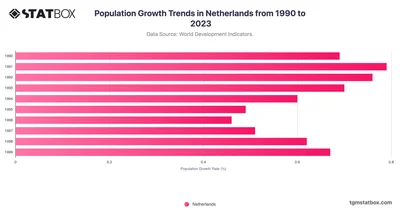
Understand the Netherlands’ population growth influenced by migration and urban expansion. Discover more statistics and insights in your target country on TGM StatBox.
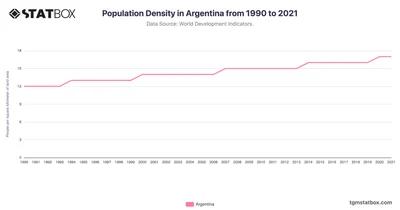
Argentina's population density rose gradually from 12 people per square kilometer in 1990 to 17 by 2021. See the full Argentina's population density data on TGM StatBox.
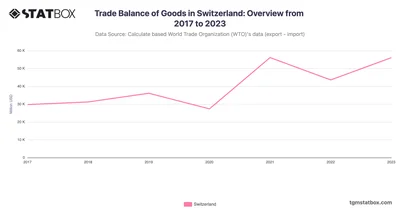
Switzerland’s trade surplus remained strong in 2023, driven by high-value pharmaceutical and precision exports. Discover more statistics and insights on TGM StatBox.
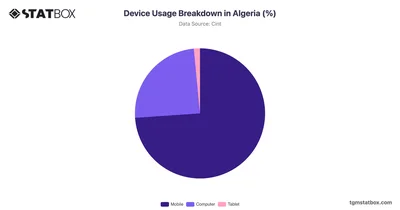
Algeria shows a strong inclination towards mobile devices, with a usage rate of 73.93%. Discover more about device usage breakdown in Algeria, on TGM StatBox.
 Pro
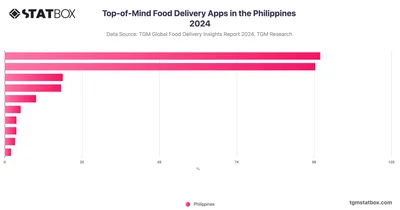
In the Philippines, Foodpanda and GrabFood are the most recognized food delivery apps, with 81.61% and 80.34% of users mentioning them first.
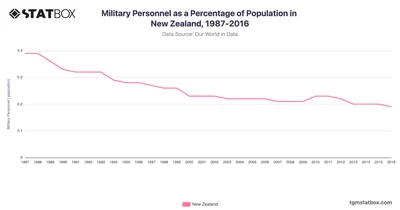
New Zealand’s military personnel as a percentage of its population declined steadily from 1987 to 2016. Discover data on New Zealand’s military personnel share on TGM StatBox.
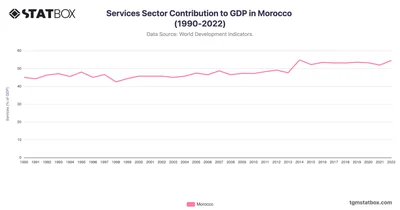
From 45% in 1990 to 54.5% in 2022, Morocco’s services sector benefitted from tourism, telecommunications, and financial services. Find more Morocco’s data on TGM StatBox.
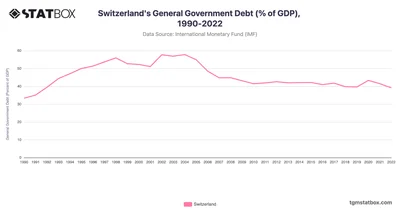
Switzerland’s general government debt ratio rose moderately in the early 1990s, from 33.3% in 1990 to around 56% by 1998. Discover more statistics on TGM StatBox.
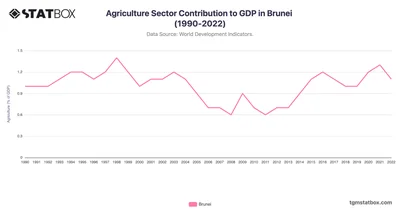
Brunei’s agriculture GDP remains minimal amid oil and gas dominance. Discover the full Brunei’s agriculture GDP data at TGM StatBox.
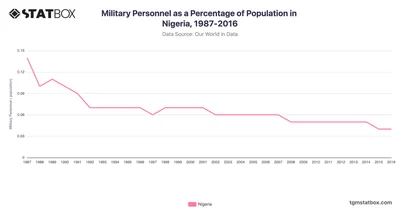
In Nigeria, the proportion of military personnel relative to the population remained consistently low from 1987 to 2016. Check full data on TGM StatBox.
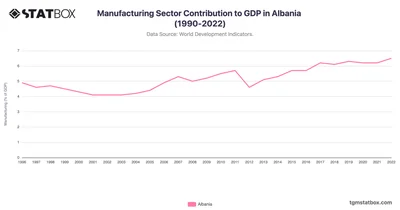
Albania’s manufacturing sector experienced gradual growth in its contribution to GDP from 4.9% in 1996 to a peak of 6.5% in 2022. See more data on TGM StatBox.
 Pro
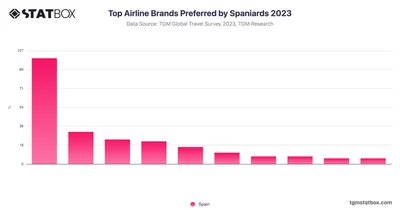
Iberia stands out as the overwhelmingly preferred airline brand among Spanish travelers, with 55.9% of respondents indicating it as their favorite.
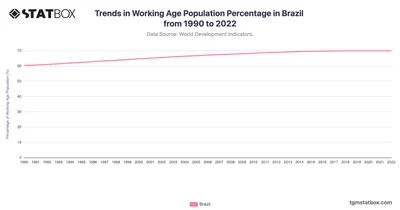
Brazil experienced a consistent rise in its working-age population, starting at 60.3% in 1990 and peaking at 69.9% by 2019. Discover complete data on TGM StatBox.
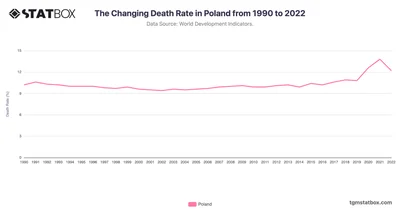
Poland’s death rate reflects demographic shifts and healthcare system improvements. Discover more statistics and insights on TGM StatBox.
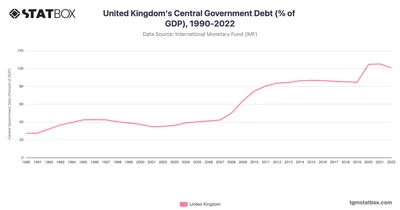
The UK’s debt peaked at 105.1% in 2021, easing to 100.75% in 2022 amid recovery efforts. Discover more statistics and insights on TGM StatBox.
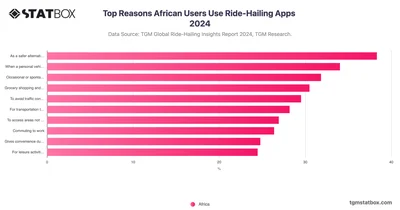
38.32% of African respondents use ride-hailing as a safer alternative, particularly when going out for events or gatherings, especially at night.