Blended Channel Preference in Christmas Gift Shopping
Christmas gift shopping sits at the intersection of tradition and convenience, where physical retail and digital commerce each carry distinct advantages. Consumers weigh factors such as tactile product assessment, delivery reliability, price comparison, and time pressure differently, making channel selection a considered rather than automatic decision during the peak retail season.
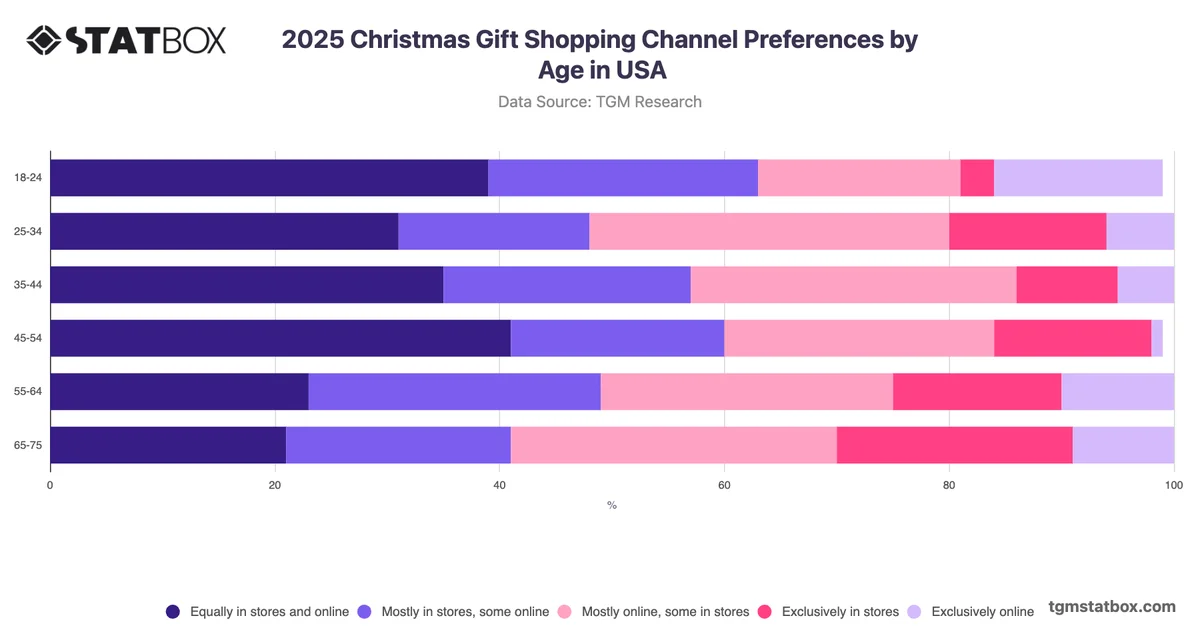
The most telling insight from US Christmas gift shopping intentions is not which single channel leads, but how strongly consumers gravitate toward mixed approaches. Taken together, those planning to use both stores and online in some combination account for 80% of respondents, while purely exclusive channel users represent only 20%. Within that blended majority, the largest single group at 32% plans to split their shopping equally between the two channels, suggesting that neither physical retail nor e-commerce has achieved sufficient standalone appeal to displace the other for most shoppers. Exclusive online shopping, at just 7%, indicates that fully digital purchasing remains a minority preference for this occasion. For retailers, this pattern points to the value of investing in integrated inventory visibility and consistent pricing across channels, as consumers appear likely to move between both environments within a single gifting season.