Early Christmas Shopping Intentions Versus Non-Participation in the USA
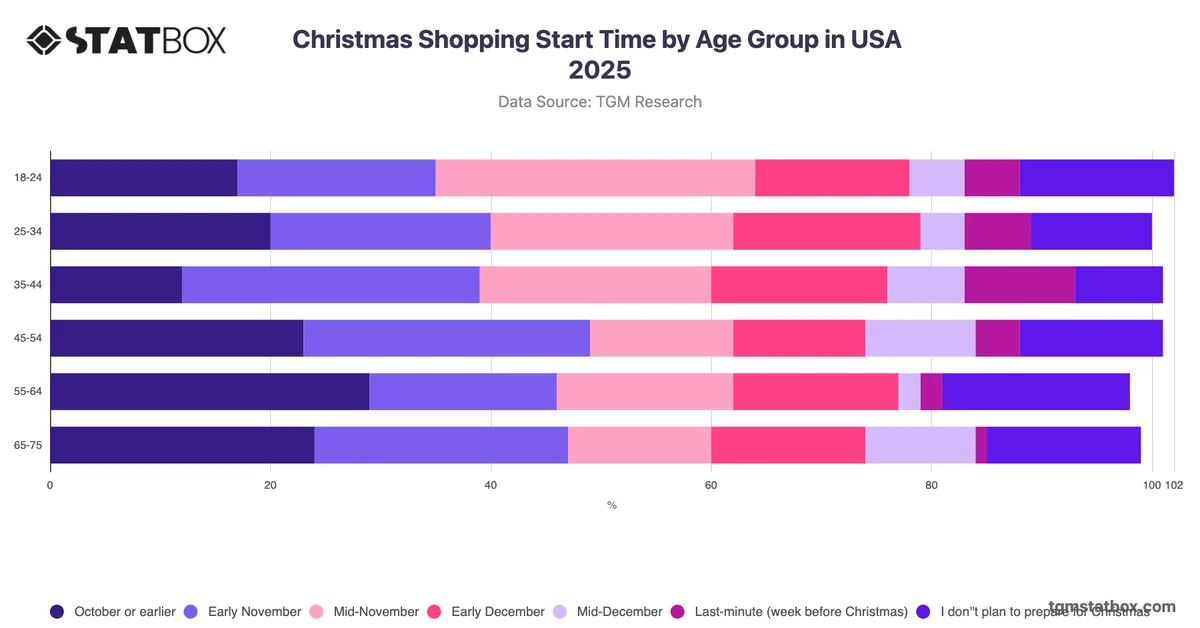
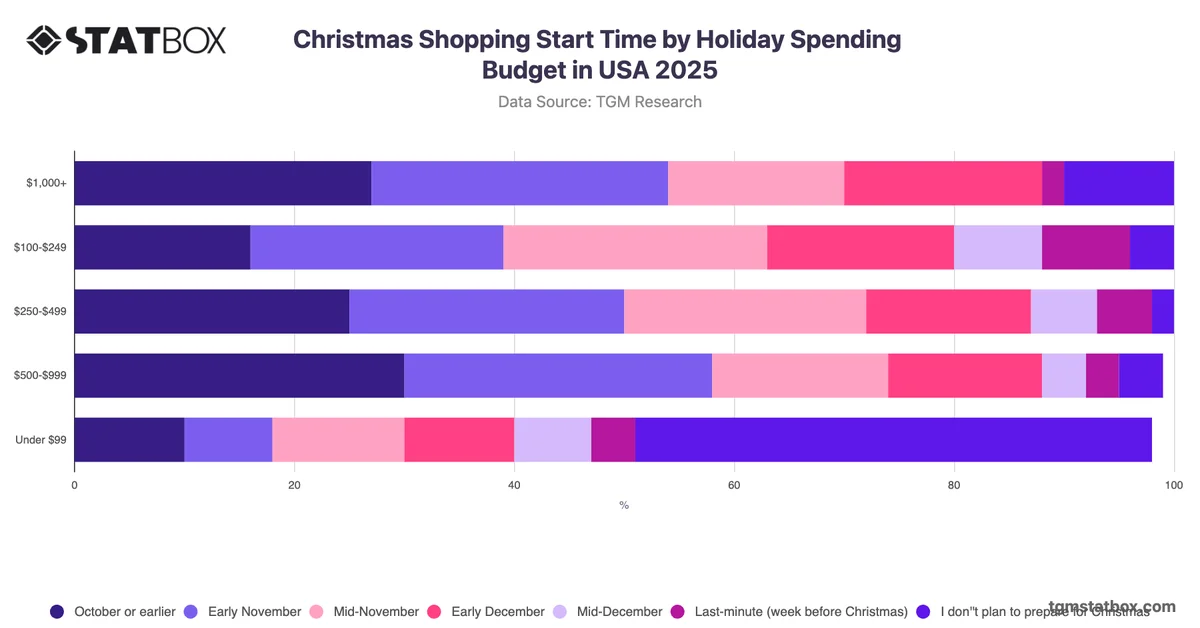
Christmas shopping planning is a critical dimension of retail strategy, as consumer decisions about when to begin purchasing directly influence inventory management, promotional timing, and category sales distribution across the fourth quarter. Understanding the spread of intended start dates helps retailers and brands allocate resources more precisely across the season.
The most analytically significant pattern in American Christmas shopping intentions is the concentration of activity in the early-to-mid season, combined with a notable segment of non-participants. Roughly six in ten Americans plan to begin shopping in October, early November, or mid-November, indicating that the majority of purchasing intent is front-loaded well before December. Yet 13% report no intention of preparing for Christmas at all, a proportion that rivals or exceeds several individual timing categories, including those planning to shop in early or mid-December. The late-season audience, comprising last-minute and mid-December shoppers, represents a comparatively small combined share. This distribution suggests that retailers prioritising December-heavy promotional calendars may be misaligned with actual consumer intent, and that campaign planning should weight October and early November more heavily to capture the largest concentration of shoppers at the point of decision.