Age-Based Variation in Christmas Gift Budget Distribution
Christmas gift spending is a significant component of household budgeting in the United States, where the holiday season represents one of the most commercially intensive periods of the year. Age plays a meaningful role in shaping spending capacity and priorities, as financial circumstances, family obligations, and gift-giving networks tend to differ considerably across life stages.
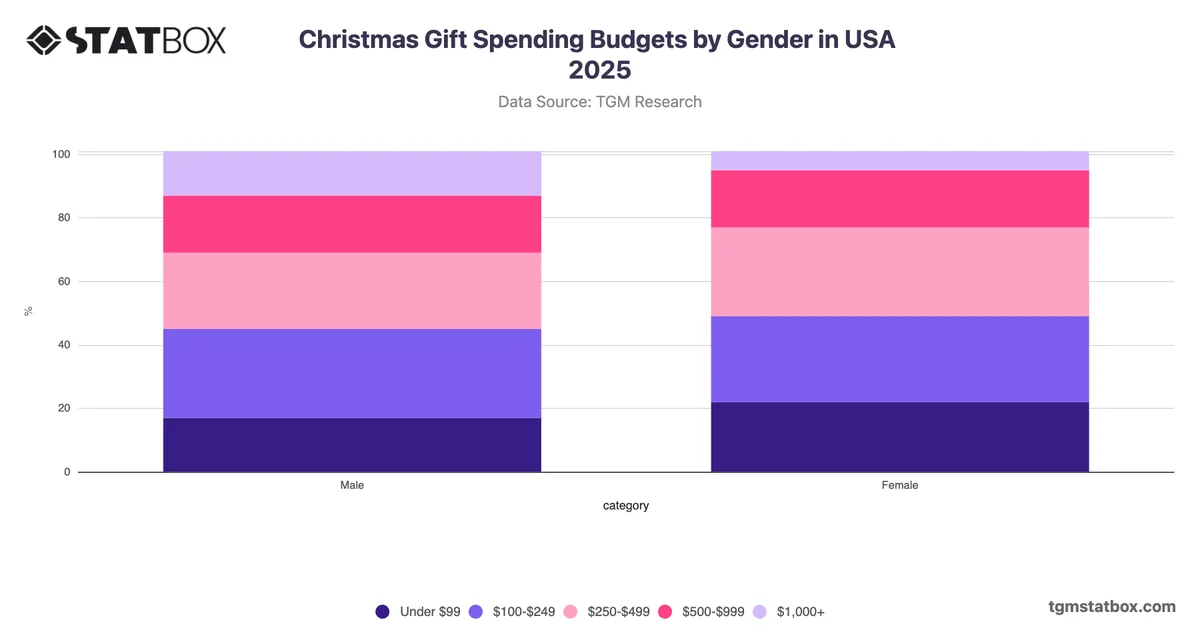
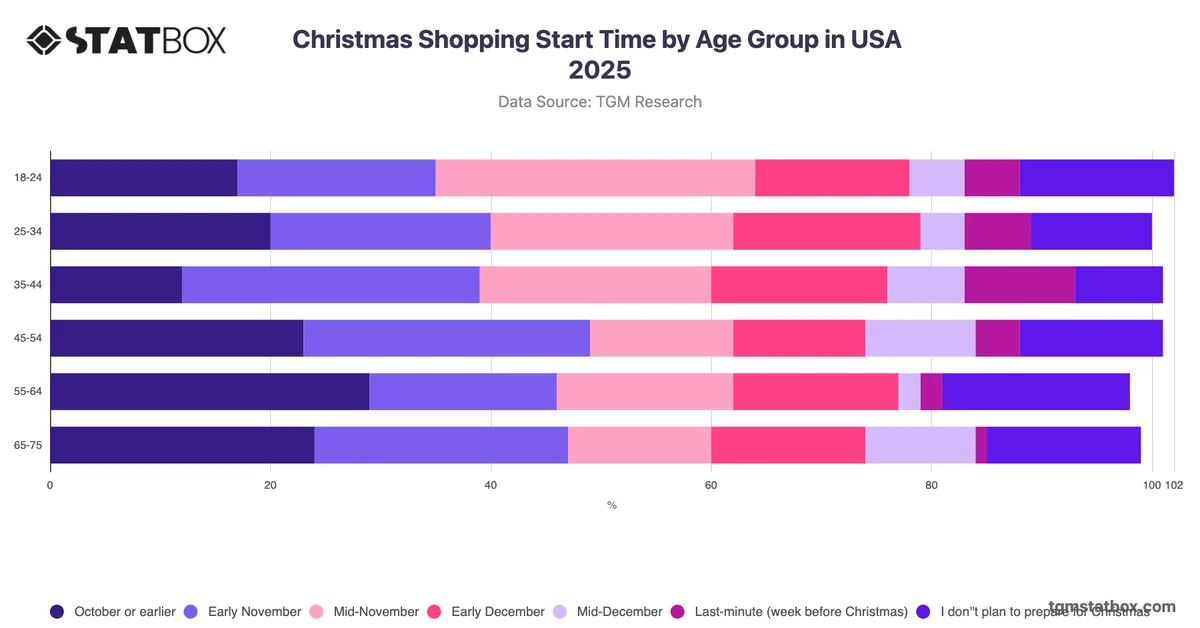
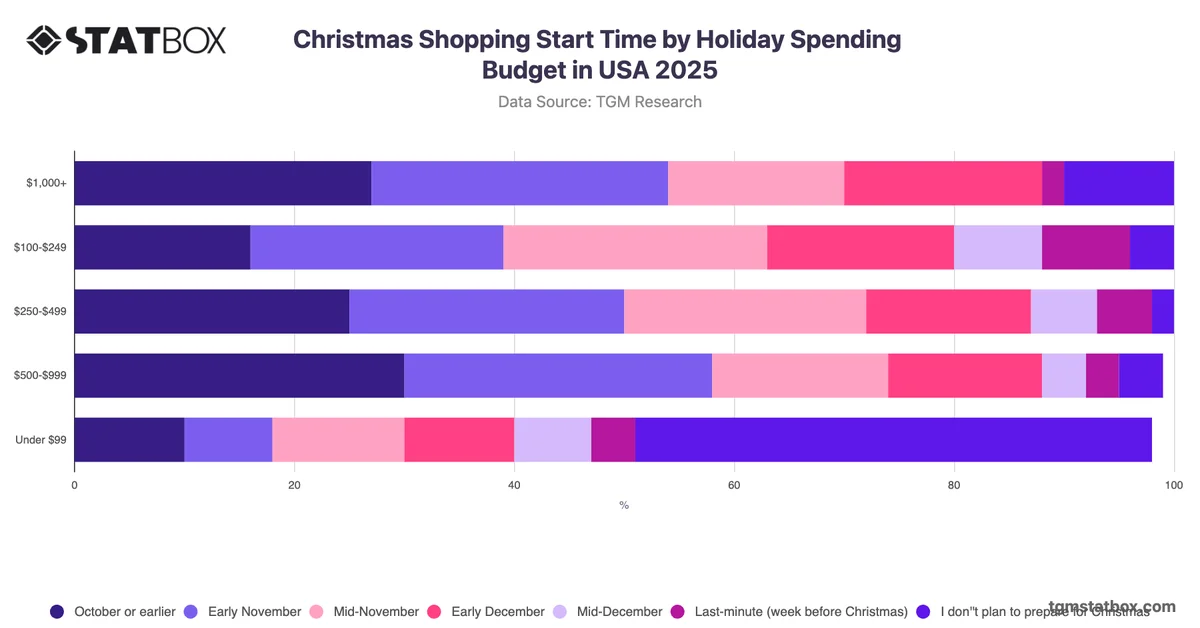
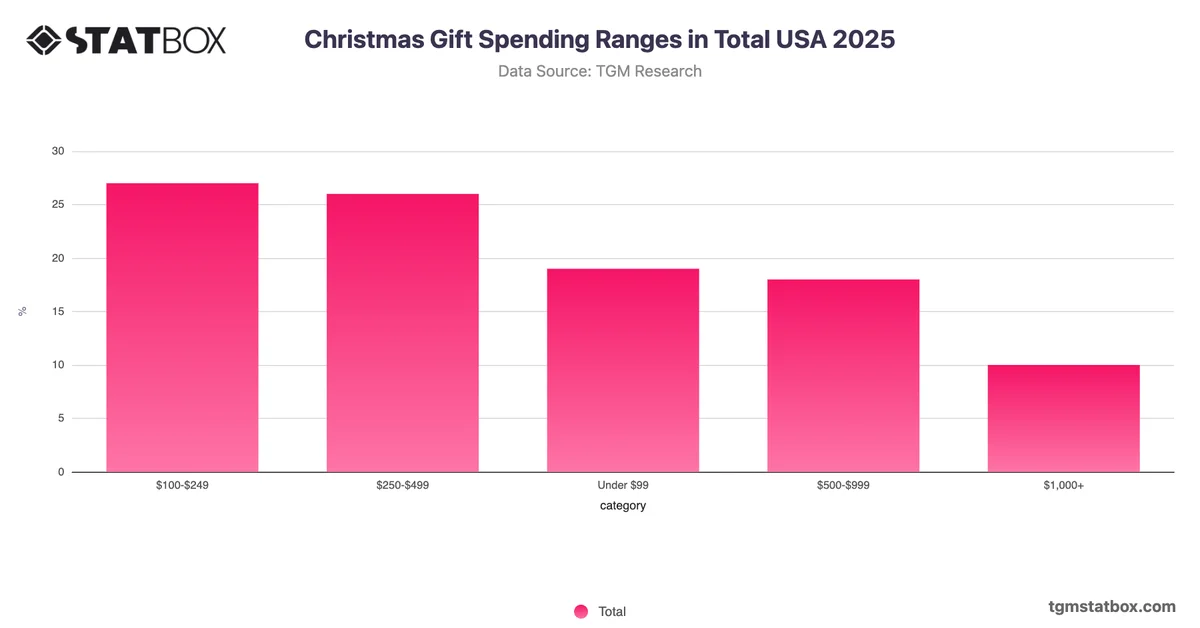
The most notable pattern across age groups is the concentration of spending in the $100–$499 range, yet the 65–75 cohort stands apart in its relatively stronger orientation toward higher expenditure. Adults aged 65–75 record the highest combined share in the $500–$999 bracket at 24%, compared to 15% among 45–54 year-olds, suggesting that older consumers with potentially fewer financial dependants may allocate more discretionary income to gifts. Conversely, mid-life adults aged 45–54 are the most likely to spend under $99, at 26%, which may point to competing household financial pressures at that life stage. The $100–$249 range draws the broadest cross-group support, indicating a practical spending ceiling for many households. Retailers and gift-focused brands should consider age-differentiated price-point strategies, particularly positioning premium gift options toward the 65–75 segment where higher individual spend appears more prevalent.