Age-Based Variation in Christmas Shopping Timing Across USA
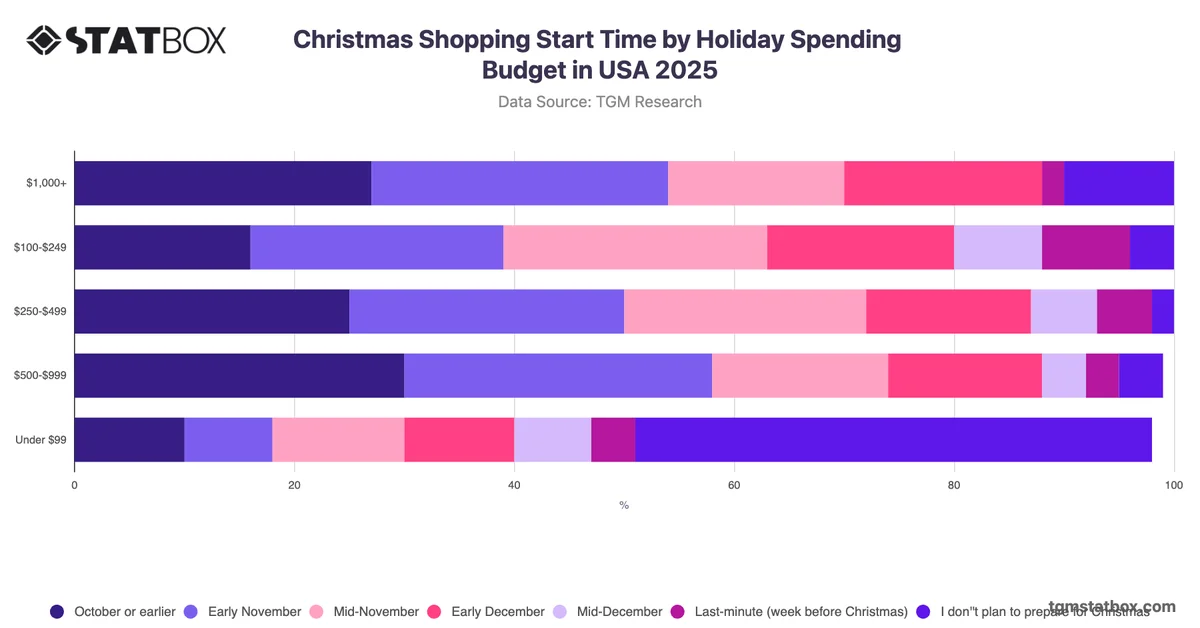
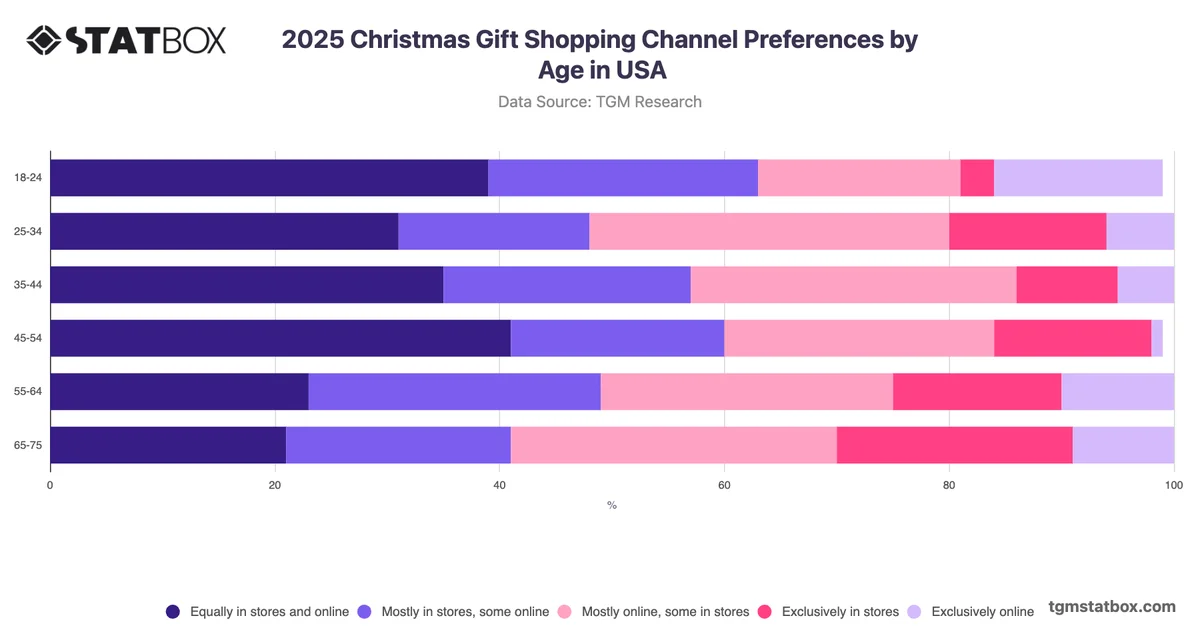
Christmas shopping timing is a critical planning variable for retailers, logistics providers, and consumer brands. When consumers begin purchasing directly influences inventory management, promotional scheduling, and fulfilment capacity. Age plays a meaningful role in shaping these decisions, as financial circumstances, household responsibilities, and planning habits differ considerably across generational cohorts.
The most notable pattern is the inverse relationship between age and early shopping readiness. Among 55–64 year olds, 29% plan to begin in October or earlier, compared with just 12% of 35–44 year olds, pointing to a meaningful generational contrast in planning horizons. Younger adults aged 18–24 concentrate most heavily in mid-November, while older cohorts lean toward October or early November. Across all age groups, however, a notable proportion, ranging from 8% to 17%, do not plan to participate in Christmas preparations at all, indicating that non-participation is a consistent and commercially relevant segment rather than a marginal outlier. Retailers targeting early-season engagement should prioritise communications to consumers aged 45 and above, while mid-November campaigns may be better calibrated toward the 18–34 demographic.