Distribution of Christmas Gift Budget Ranges Among U.S. Consumers
Christmas gift spending is a significant component of annual household budgets in the United States, with consumer decisions shaped by a combination of personal financial circumstances, gift recipient expectations, and the breadth of relationships individuals feel obligated or motivated to acknowledge during the holiday period.
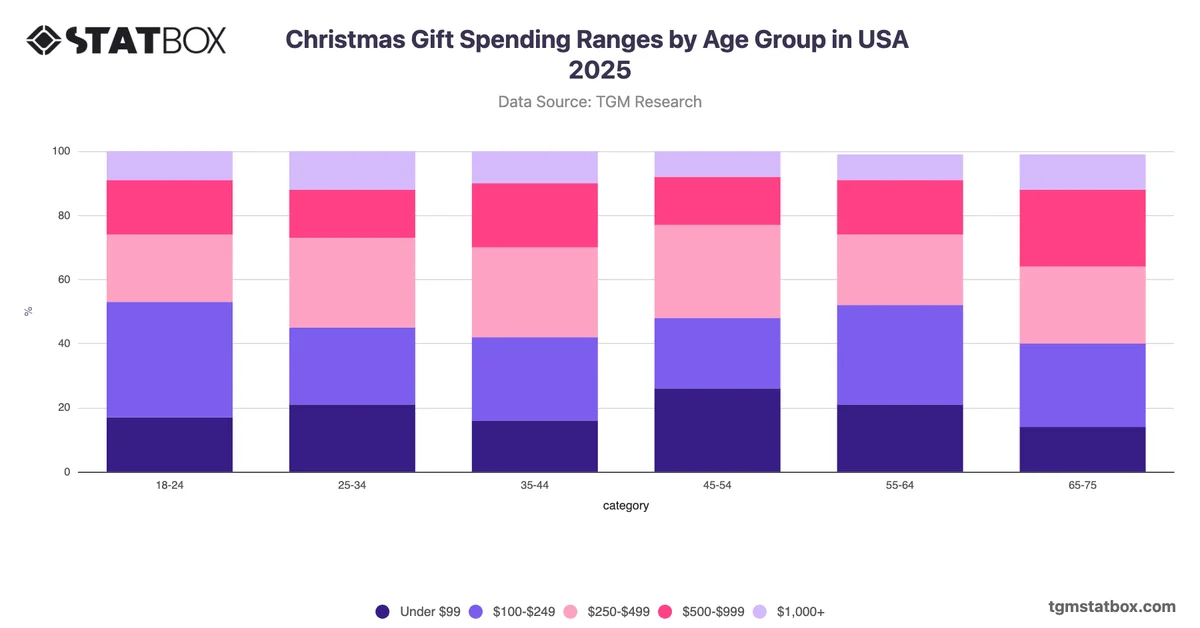
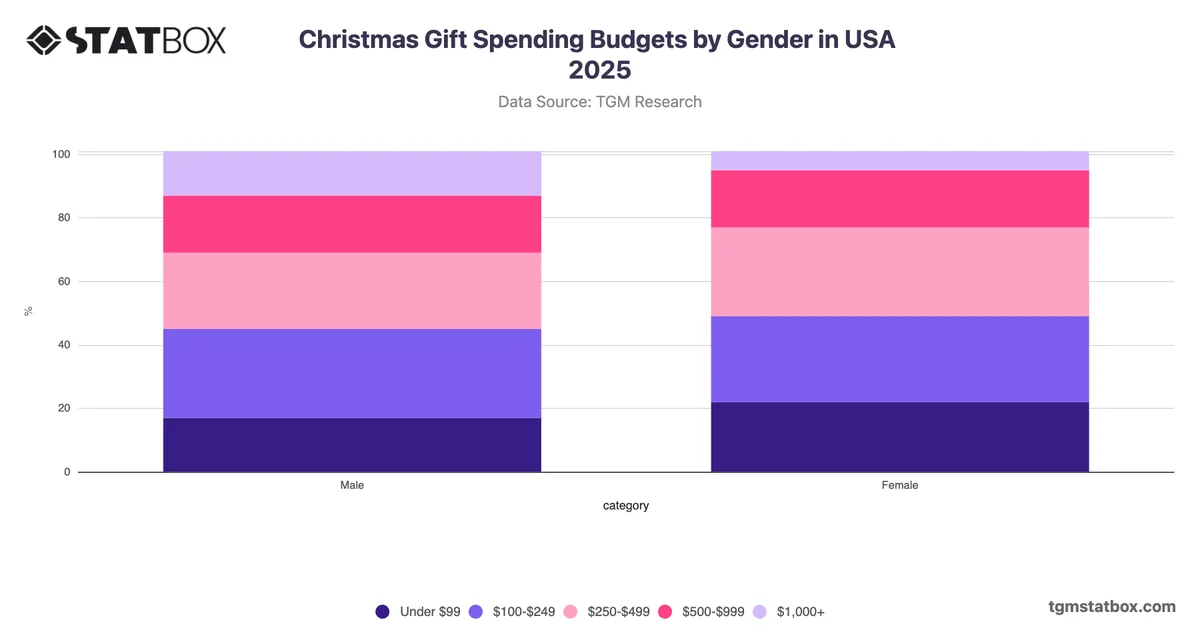
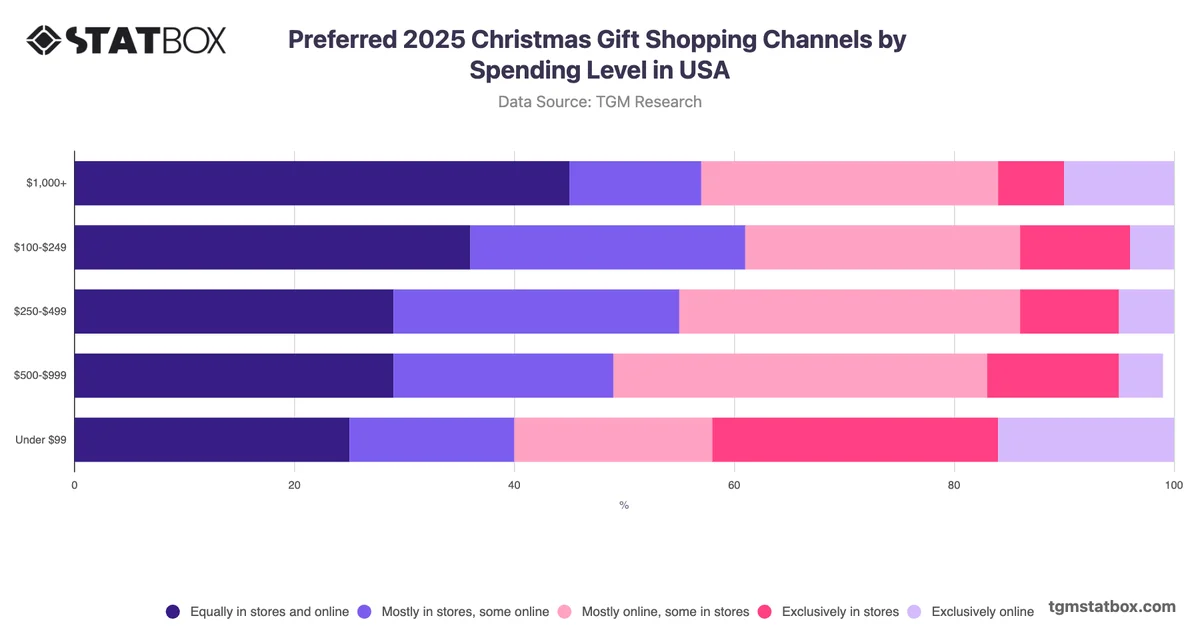
The most notable pattern in U.S. Christmas gift spending is its broad distribution across budget ranges, with no single tier commanding a dominant share. The $100–$249 range attracts the largest proportion of consumers at 27%, yet the adjacent $250–$499 bracket is nearly as common at 26%, indicating that mid-range spending is where the majority of the market clusters. Taken together, these two tiers account for more than half of all respondents, suggesting that moderate but meaningful investment characterises the typical U.S. Christmas budget. At the same time, one in ten consumers plans to spend $1,000 or more, pointing to a distinct high-value segment that warrants separate consideration. Retailers and brands targeting holiday gifting should consider tiered product and promotional strategies that serve both the concentrated mid-market and the smaller but commercially significant premium segment.