Age-Based Divergence in Christmas Gift Shopping Channel Preferences
Where consumers choose to purchase Christmas gifts is shaped by a combination of convenience expectations, channel trust, and habitual behaviour. In the United States, the coexistence of physical retail and e-commerce means shoppers have genuine choice across channels, making the distribution of preferences across age groups a meaningful indicator of how different generations approach holiday purchasing decisions.
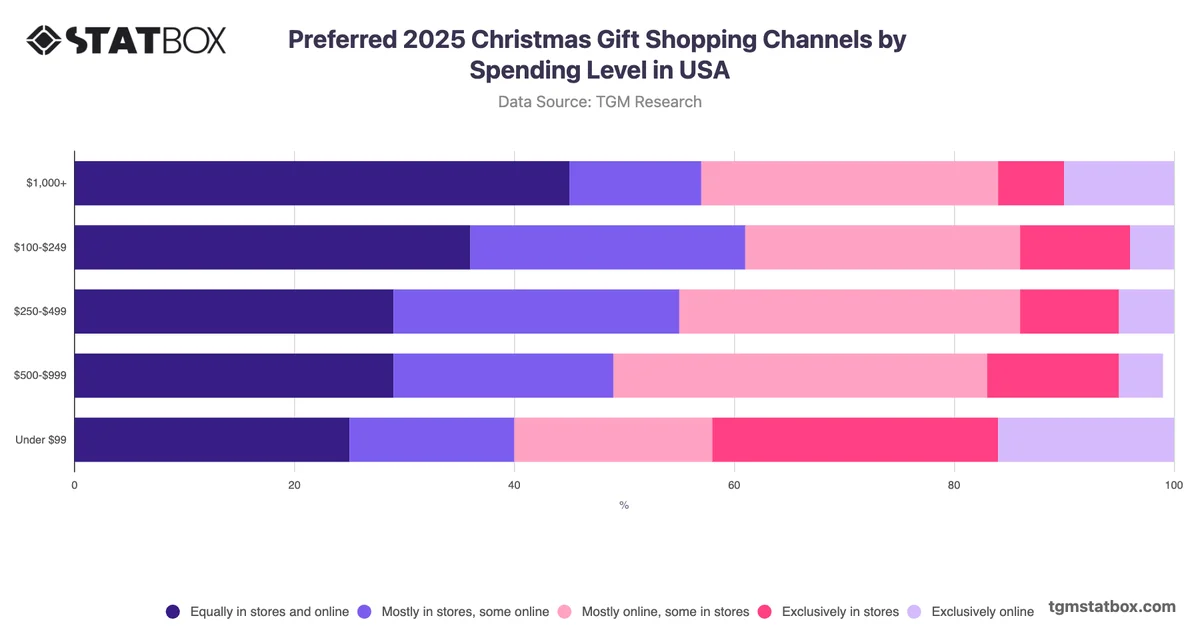
The most notable pattern across age groups is not a uniform move toward online shopping but rather a persistent preference for blended channel behaviour, with notable divergence at the extremes of the age range. Among 45 to 54 year olds, 41% favour an equal mix of in-store and online shopping, the highest proportion across all groups, while exclusive in-store shopping rises steadily with age, reaching 21% among those aged 65 to 75. Conversely, younger adults aged 18 to 24 show a comparatively higher rate of exclusive online purchasing at 15%, a figure that drops sharply among older cohorts. This pattern suggests that blended shopping remains the dominant mode across most age segments, but the balance tilts toward physical retail as age increases. For retailers planning Christmas campaigns, these contrasts indicate that channel investment and messaging should be calibrated by age segment rather than applied uniformly, with in-store experience prioritised for older audiences and digital convenience for younger ones.